


International Egg and Poultry Review: US
US - This is a weekly report by the USDA's Agricultural Marketing Service (AMS), looking at international developments concerning the poultry industry. This week's review looks at US exports of leg quarters.From January to June 2011, the top destination of US leg quarters was Mexico at 79,000 metric tons (MT), five per cent more than a year ago. Following behind was Angola (49,000MT), Iraq (45,000MT), Georgia (36,000MT), Russia (36,000MT), Latvia (33,000MT), Viet Nam (32,000MT), Taiwan (29,000MT), United Arab Emirates (27,000MT), Guatemala (25,000MT).
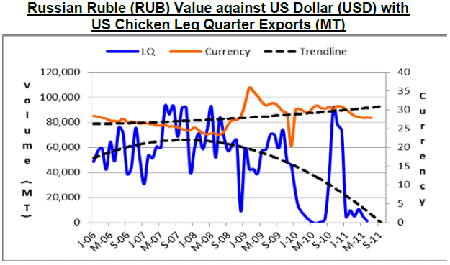
Mexico also led the way from January to June 2010 at 75,000MT. However, leg quarter exports increased to Russia in the second half of 2010 surpassing Mexican exports becoming the lead marketplace for US leg quarter exports. In 2010, the US exported 307,000MT of leg quarters to Russia versus 151,000MT to Mexico.
The top destinations of US leg quarters in June 2011 were Mexico (16,000MT), Georgia (9,000MT), Viet Nam (8,000MT), Angola (7,000MT), South Korea (7,000MT), Taiwan (4,000MT), Guatemala (4,000MT), United Arab Emirates (4,000MT), Jordan (3,000MT) and Iraq (3,000MT).
Export data suggests the US has been successful developing other markets for its leg quarters beyond Russia and China, previously lead export markets for the US, despite a number of issues, i.e. Russia's reduced quota, China's anti-dumping and countervailing duties, ongoing anti-dumping case with Mexico, high grain costs, weakness of the US dollar, and others.
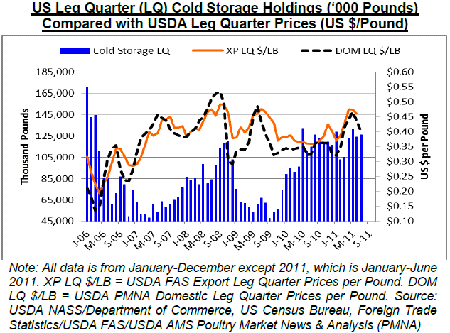
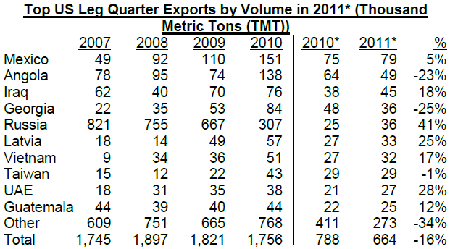
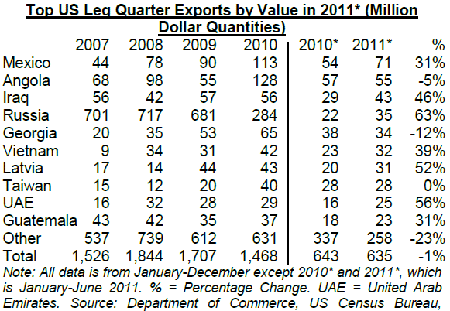
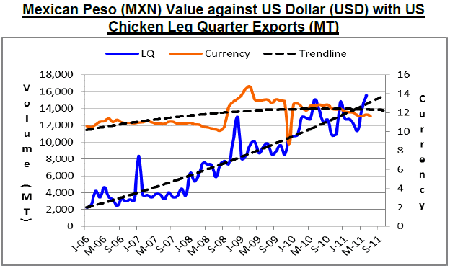


Note: All data is January-December except for 2011*, which only includes exports from January-June 2011. Source USDA FAS.
Further Reading
| - | You can view the full report by clicking here. |


