CME: Corn & Soybeans Have Modest Yield Reduction
US - USDA’s monthly Crop Production and World Agricultural Supply and Demand Estimates, released on Wednesday indicate modest reduction in both yield and crop size for both corn and soybeans but do not involve higher price forecasts for either corn or soybean meal, the key items for livestock and poultry costs, write Steve Meyer and Len Steiner. 11 November 2011
 2 minute read
USDA’s balance sheets for both corn and soybean meal appear on page two (See full report). Some highlights are:
USDA reduced its estimate of the corn yield by 1.4 bushels per acre to 146.7. That figure is 6.7 per cent below the 2006-2010 trend yield and 9.1 per cent below the 1996-2010 “biotech” era trend yield. The deviation from the longer-term trend is the largest since yields fell 7.8 per cent short of the trend value in 2002. The deviation from the “biotech era” trend is the largest to date. Several analysts expect the final January yield figure to be lower yet.
USDA did not change its acreage figures from the October estimates. We still think harvested acres as a percentage of planted acres looks high given the challenges of this crop year but we doubt there will be any substantive changes in these numbers from here to the final estimates in January.
USDA again reduced estimated feed and residual usage by 100 million bushels. This month’s figure of 4.6 billion bushels is four per cent lower than last year and 10 per cent lower than in 2009-10. “But there are so many more DDGS available” some will say. However, adding back in NET DDGS supply (production at 17 pounds per bushel of corn going into ethanol minus projected exports) and counting the DDGS as a straight corn substitute, the total corn + DDGS available this year is four per cent lower than last year and 9.7 per cent lower than the year before. We remain doubtful that feed usage can fall by this much for the coming crop year. Where will fewer cattle and chickens and more hogs balance out?
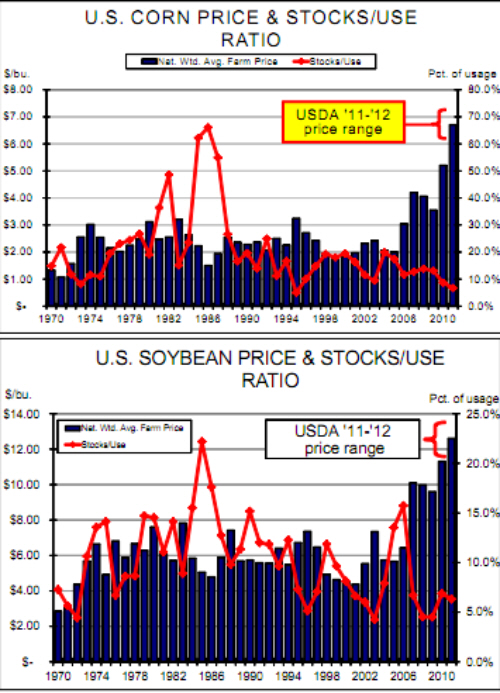
USDA let stand its estimates for ethanol and non-ethanol food and industrial usage as well as exports. It also left it’s projected price range the same given only a slight reduction in projected year-end stocks/use ratio to 6.7 per cent. As can be seen at top right, that is still the second lowest S/U ratio on record.
There were even fewer changes for soybean forecasts . USDA reduced its yield estimate to 41.3 bushels per acre from October’s 41.5. With no change to harvested acres, that yield reduction dropped production by 14 million bushels. The only usage change was a 50 million bushel reduction in projected exports.
Projected year-end soybean stocks rose to 195 million bushels or 6.3 per cent of total usage. That is significantly higher than last month’s 5.1 per cent, resulting in USDA knocking 55 cents/bushels off of both ends of its projected price range. As can be seen in the lower chart, the 6.3 per cent S/U ratio is still among the lowest on record. This marks the fifth straight year of S/U ratios less than seven. Prior to the 2007/2008 crop year, that had happened only four times since the mid-1970s.
USDA knocked $45/ton off both ends of its soybean meal price forecast range. The mid-point of the new range ($310 to $340/ ton) would put meal at $325/ton, seven per cent lower than last year. Continuing strong oil prices are a key factor in lower meal values.
USDA made only slight adjustments to its 2011-12 wheat estimates. Acres remained at 45.7 million, the average yield was reduced to 43.7 bushels/acre. Total production dropped from 2.008 million to 1.999 million bushels. All usages remained the same as in October. USDA’s forecast all-wheat price range fell to $7.05 to $7.75/bu. That compares to $5.70/bu. in ‘10-’11.
Further Reading
| - | You can view the full report by clicking here. |