CME: Price-Quantity Relationship Shows High Export Impact
US - The impact of output reductions and higher exports for US beef and pork can be clearly seen when one considers the price-quantity relationships for 2011, writes Steve Meyer and Len Steiner. 24 January 2012
 1 minute read
 By:
By: Moreover, the situation for the poultry sectors can be seen in stark contrast to those of the "red"? meats by considering the same graphics.
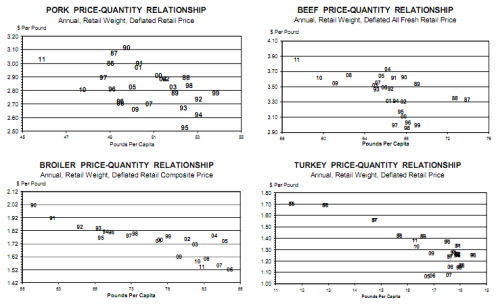
The scatter diagrams below show annual per capita consumption in retail weight on the X axes and deflated retail price on the Y axes. The consumption data come from the Livestock Marketing Information Center while the retail price data are the standard USDA weighted averages that are based on Bureau of Labor Statistics data.
The CPI for all goods is used to deflate the prices to 2005 dollars. As you can see, US domestic per cap consumption of beef and pork - which readers of DLR know is actually "disappearance"? which, in turn, is actually "availability" - has fallen sharply in recent years.
Pork per cap consumption most recently peaked at 50.8 pounds in 2007. It is now estimated to be only 45.9 pounds for 2011, a decline of almost 10% with roughly a third of that decline occurring last year. Beef consumption was roughly 65 pounds per person for each year from 2003 through 2007 before it, too, fell steadily to last year's 57.4 pounds, a decline of about 12%.
The prices of both "red"? meats increased as domestic product offerings fell, suggesting that demand (which reflects consumer preferences through the price they are willing to pay for the quantity offered) has fared better than has consumption.
The scatter diagrams for chicken and turkey look much different, though. First, per cap consumption for both species is still nearer the high end of the historic range than at the low end. Second, 2011 did not see dramatic changes for domestic product offerings.
Chicken producers, of course, accomplished that stability by accepting prices that fell far short of costs for most of the year - a course of action that cannot continue. It is almost certain that the 2012 observation will involve a lower quantity but the question is whether we will finally see a higher chicken price to go with it.
The '11 P-Q observation for turkey suggests higher demand relative to recent years as deflated prices rose on hardly any decline in product offerings. Since 2005, chicken demand has fallen while turkey demand has grown.