CME: Focus This Month is on Harvested Acres
US - USDA will release its latest estimate of U.S. and world agricultural output and usage Wednesday at 7:30 CDT when its monthly Crop Production and World Agricultural Supply and Demand Estimates (WASDE) are released, write Steve Meyer and Len Steiner. 10 September 2012
 3 minute read
 By:
By: While the trade will,
quite understandably, be looking at USDA’s
yield estimates, the focus this month is really
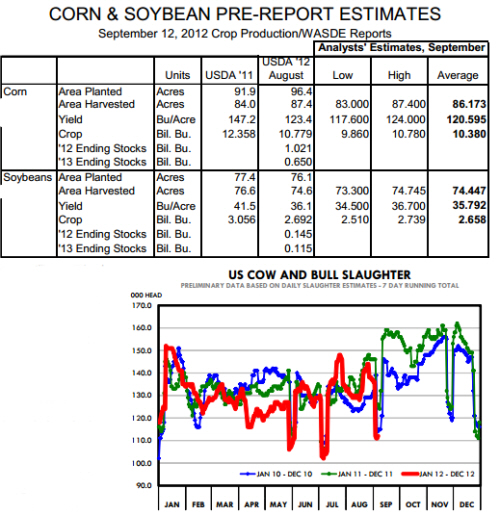
on harvestedacres. USDA has pegged those
figures at 87.4 million for corn and 74.5 million
for soybeans in the August reports. That figure
for corn is the high of analysts’ pre-report estimates for this month’s report with the average
estimate being 86.173 million. That would be
just 89.4% of planted acres, the lowest harvested percentage since 2003-04 when 87.9% of
acres were harvested. It would still be 3.4%
more than were harvested in 1988, the year of
the last severe drought in the U.S. Cornbelt.
This is not to say that there is agreement on what USDA will say on yields. Estimates are still over 7 bushels per acre apart from low to high. But they are significantly skewed to
the low side. That is not a surprise given recently published estimates.
In fact, we were a bit surprised to see the average above 120 bushels
per acre given all of the estimates in the 110s over the past few weeks.
A crop of 10.380 billion bushels would mean another 400 million bushels would have be cut from usage as we don’t see much way to take
carryout stocks below the 650 million estimated in August.
The bean side is not quite as dire. Harvested acres and yield
estimates are expected to drop slightly from USDA’s August figures as
late-season rains came in time to have some impact on beans in some
areas. The average crop estimates is only 2.3% lower than in August.
Cow and bull slaughter have dropped well below the levels of last year since mid-August. The chart at right shows the 7-day
running total of USDA’s daily cow and bull slaughter estimate, which
spiked sharply higher back in late July but has moderated since that
time. Where this number was 10-12% higher, year-on-year, back in
July, it has been 10-12% lower in each of the past four weeks.
The devil, of course, is in the details which are not included in
the weekly estimates but are available only two weeks in arrears. Total
cow slaughter for the week that ended August 24 was 8% lower than
last year. That follows weeks of –8.7%, -7.2% and –6.5%. But the
breakdown of that slaughter is telling. Dairy cow slaughter during those
four weeks was up 10.9%, 7.7%, 12.5% and 9.8%, respectively, from
their 2011 levels. Beef cow slaughter was down nearly 20% in each of
those four weeks.
The beef cow comparisons, though, are a trap since the beef
sector in Texas and Oklahoma was in full-fledged retreat last year in the
face of a monumental drought. The 80,000-plus runs of cull beef cows
last year were the highest since the last liquidation phase for the beef
sector back in 1996. This year’s August totals in the low 60,000s are
roughly comparable to 2010 when pasture conditions were not nearly as bad as either last year or this year. While national range conditions
are still much worse than one year ago, we need to remember that this
herd has already been cut significantly. Just how much farther can it go
down? It probably “can” get smaller. But already-lower numbers and
the promise of good times for those that can hold on will keep the fall
slaughter run of beef cows sharply lower than in 2011, we think.
Dairy cow slaughter for the week of August 24 was 59,950
head. That is the fourth largest figure for that week in our data that go
back to 1986 and the second largest since 1987. This sector, of
course, is much more susceptible to grain and hay prices. In addition, it
can see immediate output price impacts by removing cows from milking
herds and reducing milk supplies.