Few Changes to USDA Crop Estimates
US - USDA made very few changes to its crop estimates in yesterday’s March World Agricultural Supply and Demand Estimates (WASDE) but the changes it did make were a bit unexpected, writes Steve Meyer & Len Steiner. 12 March 2015
 3 minute read
 By:
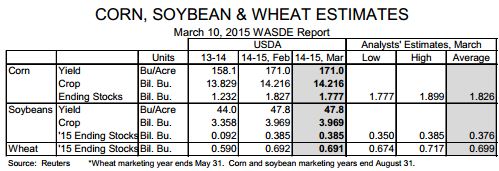
By: The March WASDE is normally driven by a “let’s see what the March stocks reports say” line of thinking but USDA got in front of that a bit by adjusting some corn usage numbers in yesterday’s report. The March estimates reduced ethanol usage by 50 million bushels and increased feed demand by the same amount, reversing the changes made in February.
The ethanol change was likely in response to lower production in recent weeks and a recent rebound in oil and gasoline prices which are likely to reduce total gasoline usage relative to what it might have been at the lowest of the recent price declines back in January.
The increase in feed usage appears justified given higher-than-expected hog numbers and robust growth in broiler output.
Finally, the WASDE added 50 million bushels to corn exports — a move that also seems to be valid but that might pose a bit of a challenge with pending South American crops and the continued strength of the U.S. dollar. Corn futures were fractionally lower in Tuesday trading but gained 3 to 5 cents in overnight trade. USDA left its estimates of US soybean supply and usage alone as well with projected year?end stocks remaining at 385 million bushels.
That figure is over 4 times as large as last year and represents the highest percentage of total usage (10.4%) since 2006 and the third highest such percentage since 1998. The trade had expected USDA to shave a bit off that year-end stocks number so soybean futures were 6 to 8 cents per bushel lower yesterday.
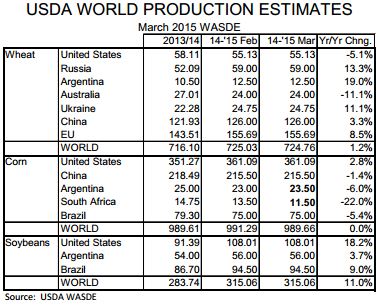
They have regained most of those losses in overnight trading, however. We include USDA’s estimates for world supplies of wheat, corn and soybeans and for the major suppliers of those crops to illustrate the expected year?on?year changes and the stability of those estimates from last month. The only changes that USDA made among the major supplies of these three crops from their February levels were a slight increase in pro? jested corn production in Argentina and a sharp reduction in South Africa’s corn output. Those changes were the major reason that projected world corn output fell by 1.63 million metric tons but left this year’s world corn crop virtually the same as in ‘13-’14.
USDA made only minor changes to its world wheat production estimates and made none for the key countries listed in the table. It made no changes at all to its soybean estimates.
We think it is interesting to recognize the differences in the proportion of total world supplies accounted for by these major – or at least noteworthy— producing countries across the various crops. The countries listed in the table account for 60.8 percent of 2013-14 wheat output and note that it takes seven of them to get to that level.
Conversely, the three countries listed for soybeans account for nearly 82 percent of 2013/14 output. The corn producing countries listed account for roughly 70 percent of world output. The dispersion of wheat production is not at all surprising given the crop’s ability to perform in much more arid climates and its resulting coverage of world crop acres.
We are always reminded of the adage that someone somewhere is planting or harvesting wheat almost every day of the year. That means that world wheat stocks as a percentage of production are always larger than the other major crops (since some region is just completing its harvest and beginning its consumption year at any point in time) and that no one country is quite as important for wheat as for the others.
The EU accounts for about 20 percent of world wheat output while the United States produces about 36 percent of world corn supplies and one-third of world soybeans. That last percentage was, of course, much higher before the growth of soybean industries in Brazil and Argentina made them significant world competitors.