CME: Corn Usage Uncertain with Changing Yields
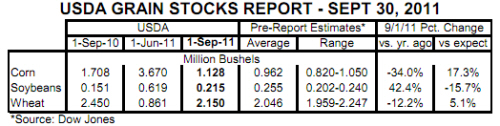
US - In basketball parlance, it is a 'jump ball' for an extra 166 million bushels of corn. That is our take on the USDA Grain Stocks report, which estimated 1 September corn stocks to be 1.128 billion bushels, 17.3 per cent more than the 0.962 billion bushels expected, on average, by analysts surveyed last week by Dow Jones, write Steve Meyer and Len Steiner. 4 October 2011
 5 minute read
The USDA estimate was 7.4 per cent above the highest estimate provided to Dow Jones survey.
CME Group Corn futures were down the permissible daily limit of 40 cents per bushel for the December and March contracts and fell by over 39 cents per bushel for the May and July contracts in Friday trading.
The question will now be where that 166 million bushels will land on the corn balance sheet for 2011-2012. Its mere presence suggests that $7-plus corn has resulted in some significant rationing of available corn supplies this summer.
But corn futures around $6 per bushel will give the green light to some uses that had tapped on the brakes.
The question is “Which one will in fact accelerate the most and use these “extra” bushels?” Or perhaps — “Will the market allow most of the volume to fall through to year-end stocks?”
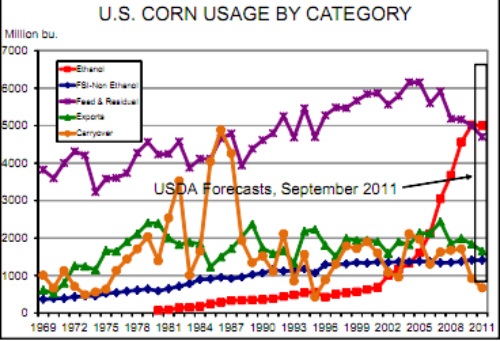
As can be seen from the chart below, the September USDA projection of 672 million bushels for 2012 corn ending stocks (ie. “carryout” for the 2011-12 crop year) was already very, very tight.
Relative to its past levels, this “usage” category is the tightest and it is quite possible the market will push these beginning inventories all the way to the bottom line of the balance sheet for the coming year.
But USDA and private analysts have been marking other uses lower for the coming year as well in anticipation of higher prices and the need to ration still tight supplies.
Dr Robert Wisner of Iowa State has consistently found “shut-down” corn prices for ethanol plants—ie. the corn price at which ethanol plants cannot cover variable costs — that were about $1/bushel higher than that cash corn market.
That relationship, in general, still holds so we do not expect ethanol usage to fall by much, if any, given these higher stocks.
The 300 million or six per cent reduction in feed usage in USDA’s September numbers still appears large to us, especially given USDA’s explanation that it would be primarily due to less residual given project high corn values.
Well, the value of those residual bushels is now below last year so why would handlers be more careful in handling it? Last week’s Hogs and Pigs report says hog numbers are slightly higher now and will grow in the second half of the corn marketing year.
Chicken numbers are indeed falling but a three per cent decline has been, historically, a HUGE adjustment in that sector. Current reductions look larger but they will almost certainly not be maintained for an entire year.
The number of cattle on feed is still far larger than one year ago and, since those cattle were placed light, we expect feed usage in feedlots to stay high relative to last year at least through the first half of the corn marketing year.
The reduction in the second half could be large, but coming up with a six per cent drop — especially if corn prices are $1.00 or more per bushel lower than had been expected — is, to us, a stretch.
It is hard to argue that food, seed and non-ethanol industrial use will drop much given its historic stability.
Last week’s announcement that USDA’s school lunch programme will not buy fruits packed in liquids based on high-fructose corn syrup (HFCS) will not, by itself, reduce this usage much even though it could have some longer-term impacts if science ever actually shows that HFCS is an obesity driver.
And that leaves exports. The US dollar has gained about seven per cent (as measured by US Dollar Index weekly futures) since the end of August as doubts about the world economy drive yet another “flight to safety” in spite of the US’s budget and deficit woes and the confidence-building manner in which they have been handled in Washington.
That change in the index has been driven largely by a 6.6 per cent increase relative to Brazil’s real and a 4.9 per cent increase relative to the Euro —and those currencies weigh significantly on US grain exports.
The changes have been much smaller relative to the Canadian (+0.2 per cent) and Australian (+1.7 per cent) dollars over that time period. These exchange rate changes, of course, all indicate LOWER exports that may actually add to 2012 year-end stocks.