

Australian Agricultural Commodities Report: Chicken Meat
Australian chicken meat production grew consistently over the decade to 2013-14, averaging nearly five per cent growth a year and will continue to increase in the coming years, according to John Hogan in the 'Agricultural Commodities' report from the Australian Bureau of Agricultural and Resource Economics and Sciences (ABARES) for the March quarter 2015.Chicken meat production is projected to continue to increase over the short to medium term and reach 1.32 million tonnes in 2019-20, compared with 1.08 million tonnes in 2013-14.
Chicken meat is projected to continue to be the most consumed meat in Australia over the outlook period, by an increasing margin.
Exports of chicken meat are projected to remain relatively low, with most production consumed domestically.
Chicken Meat Production to Grow
Australian chicken meat production grew consistently over the decade to 2013-14, averaging nearly five per cent growth a year. Production reached 1.08 million tonnes (carcass weight) in 2013-14. Chicken meat now accounts for nearly one-quarter of meat production in Australia, compared with 20 per cent in the previous decade.
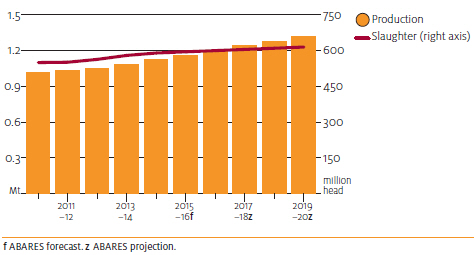
Growth in chicken meat production is forecast to continue over the short to medium term. In 2014-15 chicken meat production is forecast to rise by almost four per cent to 1.125 million tonnes and a further three per cent in 2015-16 to 1.16 million tonnes. By 2019-20, Australian chicken meat production is projected to be around 1.32 million tonnes, with its share of total Australian meat production increasing to 28 per cent.
Domestic Demand to Increase
Projected growth in chicken meat production over the next five years is largely in response to an ongoing increase in domestic demand, as retail prices of chicken meat remain well below prices of alternative meats. The domestic market is projected to ontinue to account for around 96 per cent of chicken meat production. Exports will comprise primarily low value cuts and offal, for which there is little domestic demand.
Australia ranks third-highest in the world in per person consumption of chicken meat, after Malaysia and Jamaica. Over the 10 years to 2013-14, growth in per person consumption of chicken meat in Australia averaged three per cent a year.
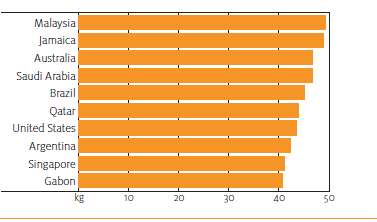
Chicken meat is expected to remain Australia’s most consumed meat over the medium term. Australian chicken meat consumption is forecast to rise by nearly two per cent in 2014-15 to 45.4kg a person and by a further two per cent in 2015-16 to 46.1kg a person. Over the medium term, consumption is projected to grow to 49.2kg a person in 2019-20.
Past and projected future growth in Australian chicken meat consumption reflects the competitive pricing of chicken meat compared with pork, beef and lamb. Over the past two decades, the prices of other meats have risen very strongly relative to chicken meat. Over the five years to 2014-15, chicken meat was on average 50 per cent cheaper than pork, 59 per cent cheaper than lamb and 65 per cent cheaper than beef. Over the medium term, chicken meat is projected to remain much cheaper than these competing meats.
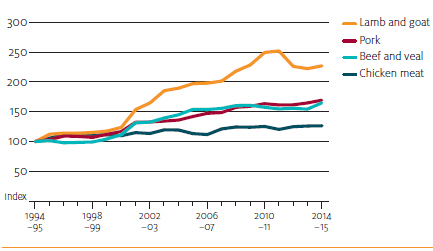
The comparatively low price of chicken meat reflects strong productivity growth achieved in the Australian industry over successive decades. Because of selective breeding techniques, chickens used for meat production reach their ideal slaughter weight in around 35 days, using a total of around 3.4kg of feed. By comparison, 64 days and 4.7kg of feed were required to bring a chicken to market weight in the 1970s.
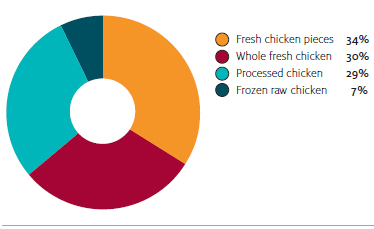
Prices for chicken meat are comparatively low, and consumers are increasingly choosing fresh over frozen or processed chicken. According to the Australian Chicken Meat Federation, consumers are increasingly preferring to purchase chicken pieces, ready to cook. However, sales of whole chickens remain strong. Fresh chicken pieces and whole fresh chickens now account for 64 per cent of all chicken sales, with fresh chicken pieces accounting for more than 50 per cent of these sales. Frozen raw chicken accounts for seven per cent of sales, while processed chicken accounts for the remaining 29 per cent of sales.
In contrast to beef and sheep meat production, the chicken meat production industry in Australia is highly concentrated and vertically integrated. Around 70 per cent of chicken meat is supplied by two privately owned processing companies. The next five privately owned medium-sized processors supply between three per cent and nine per cent of the market, with a large number of smaller processors accounting for the balance of the market. Chicken meat farmers are generally contracted by processing companies to grow out day-old chicks supplied by the companies.
Exports to Remain Relatively Small
Exports account for around four per cent of Australian chicken meat production. About 95 per cent of exports comprise frozen cuts and offal such as feet, kidneys and livers. These attract a higher price in export than domestic markets. The remaining five per cent of exports largely comprises frozen whole chickens. Very little fresh chicken meat is exported.
Chicken meat exports are forecast to increase by 14 per cent in 2014-15 to 40,500 tonnes (shipped weight) and a further three per cent in 2015-16 to 41,600 tonnes. Forecast growth in domestic production will contribute to an increase in supply of frozen cuts and offal for export. Demand for these products in South-East Asia and the Pacific is expected to rise in the short term.
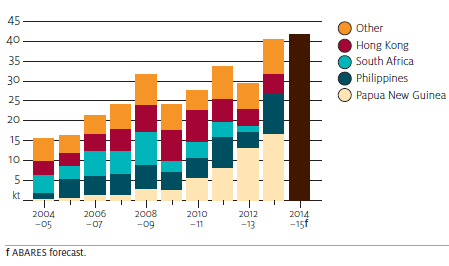
Over the medium term, Australia’s chicken meat exports are projected to remain at around 4 per cent of production, increasing to 47 400 tonnes by 2019–20. Frozen cuts and offal are likely to make up most of Australia’s chicken meat exports over the projection period.
Australia imports very little fresh, chilled, frozen or processed chicken meat or edible chicken offal. This is because of biosecurity restrictions intended to prevent entry of diseases that could affect the Australian chicken flock.
Sources ABARES, Australian Bureau of Statistics
| Table 1. Outlook for chicken meat | ||||||||
| 2012-13 | 2013-14 | 2014-15 f | 2015-16 f | 2016-17 z | 2017-18 z | 2018-19 z | 2019-20 z | |
|---|---|---|---|---|---|---|---|---|
| Production a, '000 tonnes | 1,046 | 1,084 | 1,125 | 1,160 | 1,200 | 1,240 | 1,280 | 1,320 |
| Consumption, kg/person | 44.1 | 44.7 | 45.4 | 46.1 | 46.9 | 47.7 | 48.4 | 49.2 |
| Export volume b, '000 tonnes | 29.3 | 35.4 | 40.5 | 41.6 | 43.0 | 44.5 | 45.9 | 47.4 |
| Export value, A$ million | 39.5 | 48.0 | 66.6 | 79.1 | 83.9 | 88.9 | 94.0 | 99.4 |
March 2015


