

Detection and Localization of Quantitative Trait Loci Affecting Fatness in Broilers
By D. G. J. Jennen, H. Bovenhuis, R. P. M. A. Crooijmans, A. Veenendaal, J. J. van der Poel, and M. A. M. Groenen, Wageningen University and A. L. J. Vereijken, Nutreco, Breeding Research Center - Across between 2 genetically different outcross broiler dam lines, originating from the White Plymouth Rock breed, was used to produce a large 3-generation broiler population.
ABSTRACT
This population was used to detect and localize QTL affecting fatness in chicken. Twenty full-sib birds in generation 1 and 456 full-sib birds in generation 2 were typed for microsatellite markers, and phenotypic observations were collected for 3 groups of generation 3 birds (1,800 birds per group).
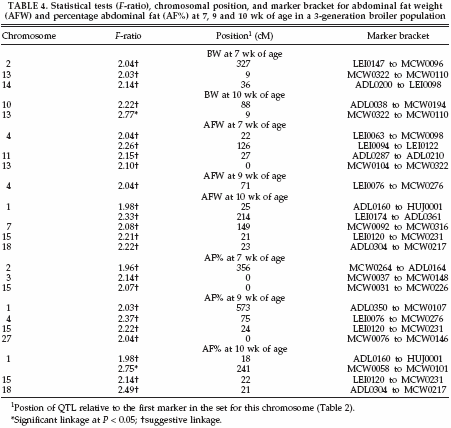
Body weight, abdominal fat weight, and percentage abdominal fat was recorded at the age of 7, 9, and 10 wk. To study the presence of QTL, an across-family weighted regression interval mapping approach was used in a full-sib QTL analysis. Genotypes from 410 markers mapped on 25 chromosomes were available. For the 3 traits, 26 QTL were found for 18 regions on 12 chromosomes. Two genomewise significant QTL (P < 0.05) were detected, one for percentage abdominal fat at the age of 10 wk on chicken chromosome 1 at 241 cM (MCW0058 to MCW0101) with a test statistic of 2.75 and the other for BW at the age of 10 wk on chicken chromosome 13 at 9 cM (MCW0322 to MCW0110) with a test statistic of 2.77.
Significance levels were obtained using the permutation test. Multiple suggestive QTL were found on chromosomes 1, 2, 4, 13, 15, and 18, whereas chromosomes 3, 7, 10, 11, 14, and 27 had a single suggestive QTL.
INTRODUCTION
In recent decades, selection of meat-type broiler chickens for reduced slaughter age has greatly increased feed efficiency. However, these modern strains selected for more rapid growth exhibit excessive body fat deposition (Mallard and Douaire, 1988; Griffin, 1996). Fat is considered to be a by-product of very low commercial value. It is a costly body component from an energy point of view, and its deposition in large amounts can depress feed efficiency.
Although several strategies of selection for leanness in meat production have been described, it is still not possible to measure fat easily (Mallard and Douaire, 1988). The measurements of fatness are often laborious and expensive. Therefore, genetic information leading to the detection of QTL and preferably to the underlying genes for these traits will benefit poultry breeding programs.
Most QTL studies in chickens are based on F2 populations obtained by crossing extreme lines. For example, in the experiments of Yonash et al. (1999), a cross between 2 White Leghorn lines, one susceptible and the other resistant to Marek’s Disease, was used for QTL analysis. Recently, QTL for growth and fatness traits were mapped in F2 populations based on crosses between fast- and slow-growing lines (Tatsuda and Fujinaka, 2001a,b), between broilers and layers (Ikeobi et al., 2002; Sewalem et al., 2002), between red jungle fowl and layers (Schu¨ tz et al., 2002; Carlborg et al., 2003), and between chicken lines selected for high and low fat content (Pitel et al., 2002). Nevertheless, crosses between less extreme lines (layerlayer and broiler-broiler crosses) also resulted in QTL for growth and fatness traits (Van Kaam et al., 1998, 1999a,b; McElroy et al., 2002; Tuiskula-Haavisto et al., 2002; Zhu et al., 2003).
In the current experiment an extended mapping population was used based on a cross between 2 genetically different outcross broiler dam lines originating from the White Plymouth Rock breed. Many microsatellite markers have been mapped in this large population, resulting in a comprehensive microsatellite linkage map (Groenen et al., 1998) that is used as a reference map in the present study. Van Kaam et al. (1998, 1999a,b) was the first to analyze this large 3-generation broiler population by means of a whole genome scan, and QTL were found for BW, carcass percentage, and growth on chromosome 1; for feed intake traits on chromosomes 2, 4, and 23; and for meat color on chromosome 2. The aim of the present study was to detect and localize QTL affecting fatness in the same 3-generation design as described by Van Kaam et al. (1998, 1999a,b).

MATERIALS AND METHODS
Experimental Population and Phenotyping
A 3-generation population was created for the purpose of QTL detection, as previously described by Van Kaam et al. (1998, 1999a,b). The population structure and number of birds is given in Table 1. The design was based on a 3-generation full-sib-half-sib design consisting of parents [generation (G) 1], full-sib offspring (G2), and half-sib grand-offspring (G3). The G0 generation consisted of 2 broiler dam lines originating from the White Plymouth Rock breed. Unrelated G1 birds were mated to produce 10 full-sib families with an average of 46G2 offspring per family. TheG1 andG2 birds were typed for microsatellite markers, and phenotypic observations were collected for 3 groups of G3 birds. Each group was raised in 6 hatches and housed in floor pens with approximately 20 birds/m2. The birds were in the same pen starting from d 0, and they could access feed and water ad libitum; illumination was 23 h/d. A commercial broiler feed was used; it consisted of crumbled concentrates containing 12,970 kJ/kg and 21% protein.
The 3 groups of G3 birds were weighed at slaughter when they were 7 wk of age (group 1), 9 wk of age (group 2), and 10 wk of age (group 3). After slaughter the weight of abdominal fat pad (AFW) was measured and adjusted for BW [percentage abdominal fat (AF%)].
Genotyping
Microsatellite markers were genotyped as described previously (Crooijmans et al., 1997). The PCR amplifications were carried out in 12-ìL reactions containing 10 to 60 ng of genomic DNA, 1.5 mM MgCl2, 50 mM KCl, 10 mM Tris-HCl (pH 8.3), 1 mM tetra-methylammoniumchloride, 0.1% Triton X-100, 0.01% gelatin, 0.2 mM of each deoxyribonucleotide, 0.25 U Silverstar polymerase,2 and 2.3 pmol of each primer, one of which was labeled with a fluorescent dye (6-FAM, TET, or HEX) at the 5Œ end. The amplification reactions were as follows: 5 min 95‹C followed by 35 cycles of 30 s at 94‹C, 45 s at 55‹C, and 90 s at 72‹C, followed by a final elongation step of 10 min at 72‹C. Depending on the marker, annealing temperatures of 45, 50, or 60‹C were used. The PCR amplification products for 14 to 21 markers from an individual DNA sample were pooled and analyzed on a 6%denaturing polyacrylamide gel, Sequagel-6,3 using an automatic sequencer.4 Electrophoresis was performed for 3 h on 12- cm gels, and the results were analyzed using the Genescan and Genotyper software.
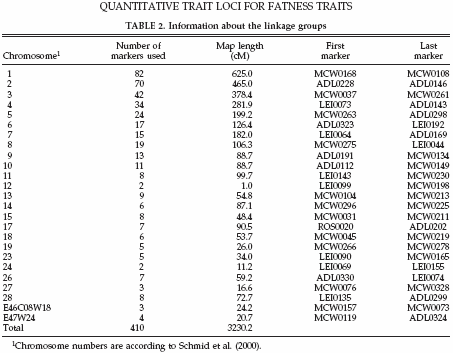
In total 410 markers were tested, 256 were determined on all 10 families, and 154 were only typed on 4 families. These markers were mapped on 25 autosomal chromosomes with an average marker interval of 7.9 cM. The linkage map used in the current study was calculated with CRIMAP (Green et al., 1990) using the marker genotypes for all these markers and all these families. The total linkage map covered 3,230.2 cM. Map distances given are sex-averaged distances in centimorgans on the Haldane scale (Haldane, 1919). More detailed information on the marker data is given in Table 2.
Full-Sib QTL Analysis
For QTL analysis, we used the regression interval mapping methodology described by Van Kaam et al. (1998, 1999a,b). The analysis is an across-family weighted fullsib regression analysis. Because marker-QTL linkage phase can differ between families, QTL analysis was nested within families. Average breeding values of G2 birds were regressed on the probabilities of inheriting the first allele of each G1 parent. Average breeding values of G2 birds were estimated based on the measurements of the G3 birds. In the model, fixed effects for sex and week of hatching were included, as were family mean in order to account for polygenic differences between families. Differences in the number of G3 birds contributing to G2 average breeding values were taken into account by applying a weighing factor, based on the variance of the average breeding values. Test statistics were calculated at each centimorgan in order to test for the presence of QTL effects versus the absence of QTL effects. The test statistic was the ratio of the explained mean square of the QTL effects in the numerator and the residual mean square of the full model in the denominator.
Significance Thresholds
Significance thresholds were calculated using the method of permutation testing (Churchill and Doerge, 1994). This method is empirical and accounts for the distribution of the marker and phenotypic data. By using the genomewise significance thresholds, 2 types of significance thresholds were derived: significant and suggestive linkages (Lander and Kruglyak, 1995). Significant linkage is defined as a 5% genomewise significance threshold, and suggestive linkage is equivalent to one expected false positive result per trait in a whole genome scan. All linkage groups were permutated together, and common thresholds were applied. For each trait, 1,000 permutations at 50-cM intervals across the genome were performed.
Permutation was also applied to determine which parents were segregating for a QTL on those locations where a QTL was detected in the across-families analysis. Per parent, a test comparing a model with a QTL versus a model without a QTL was applied, accounting for the presence or absence of QTL effects in the mate. Parents with a test statistic above the 10% chromosomewise threshold were considered to be segregating for the QTL. The 10% chromosomewise thresholds were calculated per parent by performing 1,000 permutations at 1-cM intervals.
RESULTS
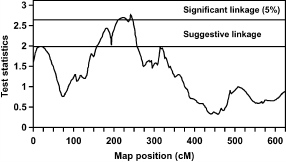 FIGURE 1. Test statistic values from the full-sib QTL analysis for percentage abdominal fat at the age of 10 wk on chicken chromosome 1. Thresholds for significance linkage at the 5% level and for suggestive linkage are indicated. |
Phenotypic Data
The overall means and standard deviations of BW, AFW, and AF% are shown in Table 3 for G3 individuals at (slaughter) ages of 7, 9, and 10 wk. Although the means and variance increased with age, the coefficient of variation stayed the same for each trait.
At every age males were heavier than females and had less abdominal fat; therefore the abdominal fat percentage was lower in the males compared with the females (data not shown).
Full-Sib QTL Analysis
The QTL with suggestive and significant linkages for each trait are summarized in Table 4. Twenty-six QTL were detected; these were divided over 18 regions on 12 chromosomes. On chromosome 1, one significant and one suggestive QTL were found for AF% at 10 wk of age. The same regions also had suggestive QTL for AFW at 10 wk of age. A third region on chromosome 1 was represented by a suggestive QTL for AF% at 9 wk of age. Also for BW at the age of 10 wk, one significant QTL was found on chromosome 13. This region also showed suggestive QTL forBWandAFWat the age of 7 wk. Multiple suggestive QTL were found on chromosomes 1, 2, 4, 13, 15, and 18, whereas chromosomes 3, 7, 10, 11, 14, and 27 had a single suggestive QTL (Table 4.).

Figure 1 shows 2 QTL for AF% at 10 wk of age on chromosome 1. The first QTL at 18 cM shows suggestive linkage, and the second QTL is at 241 cM, which is significant at the 5% level. To study the number of families contributing to these 2 QTL, allelic effects, their standard errors, and t-values were calculated for all families. Results suggest the segregation of the first QTL in 1 sire, of family 6, with an allelic effect of -0.33% (SE 0.09). The second QTL segregated in 1 sire of family 9 and in 2 dams of families 5 and 9 with allelic effects of .0.71% (SE 0.28), .0.83% (SE 0.21), and .0.48% (SE 0.14), respectively. The average allele substitution effect (á) of the second QTL in the 3 sires/dams was equal to 0.84 additive genetic SD. Also for the QTL for BW at the age of 10 wk on chromosome 13 (Figure 2), the number of families contributing to the QTL was studied. The QTL on chromosome 13 segregated in 2 sires of families 4 and 5 and in 2 dams of families 2 and 5 with allelic effects of .53 g (SE 14), .70 g (SE 22), 46 g (SE 18), and 49 g (SE 22), respectively. The average allele substitution effect (á) of the QTL in the 4 sires/dams was equal to 0.29 additive genetic SD.
DISCUSSION
QTL for Fatness Traits
The most significant results in the current QTL study were found on chromosome 1 for AF% at the age of 10 wk and on chromosome 13 for BW at the age of 10 wk. These QTL explain 18.1 and 26.6% of the total genetic variance, respectively.
Van Kaam et al. (1998, 1999a) found QTL for BW at the age of 48 d on chromosome 1 with confidence intervals that overlap with the QTL for AFW and AF% at the age of 10 wk. Although a low genetic correlation has been found between BW and AF% (Le Bihan-Duval et al., 1999, 2001; S. Zerehdaran, 2003, Animal Breeding and Genetics Group, Wageningen University, Wageningen, The Netherlands, personal communication), which suggests that BW and AF% are affected by different genes, it cannot be excluded that the region on chromosome 1 represents a pleiotropic QTL. In the present study however, no QTL for BW was found on chromosome 1. This result is most likely caused by the differences in performance of the chickens in the current study compared with those used in the studies of Van Kaam et al. (1998, 1999a), which were kept under different housing conditions (i.e., free housing versus individual housing).
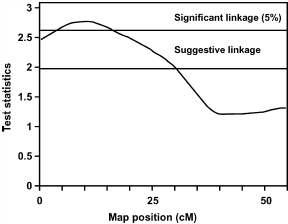 FIGURE 2. Test statistic values from the full-sib QTL analysis for BW at the age of 10 wk on chicken chromosome 13. Thresholds for significance linkage at the 5% level and for suggestive linkage are indicated. FIGURE 2. Test statistic values from the full-sib QTL analysis for BW at the age of 10 wk on chicken chromosome 13. Thresholds for significance linkage at the 5% level and for suggestive linkage are indicated. |
Although, several studies resulted in QTL in the same chromosomal regions, one should keep in mind that in these studies different breeds and measurements were used (Tatsuda and Fujinaka, 2001a,b; Ikeobi et al., 2002; McElroy et al., 2002; Sewalem et al., 2002; Carlborg et al., 2003). For example, in the study of Ikeobi et al. (2002) a broiler-layer cross was used, and fatness traits were measured at 2 kg live weight when they were 9 wk of age. In the present broiler-broiler cross, the chickens were already heavier at the age of 7 wk. Also at this age the birds had more abdominal fat, but AFW was lower compared with the birds in the study by Ikeobi et al. (2002).
Potential Candidate Genes
The QTL regions found in the present study ranged from 50 to 100 cM, each containing up to 1,000 genes. Therefore, the chance of finding the gene(s) underlying the QTL was very low (<0.1%). However, studies on obesity and other fat-related traits in human, mouse, and agricultural species provide useful information that can be used to identify potential candidate genes in the chicken. Based on the comparative maps among human, mouse, and chicken, a selection of potential candidate genes can be made specific to the regions of interest.
In the current study the most interesting QTL for the fatness traits was the significant QTL for AF% at the age of 10 wk located on chicken chromosome 1. This QTL region on chromosome 1 shows conservation of synteny with parts of human chromosomes 12 and 22 (Schmid et al., 2000). Potential candidate genes mapped in the region on chicken chromosome 1 are peroxisome proliferative activated receptor-ƒ¿ (PPARA), insulin-like growth factor- I (IGF-I), high mobility group I-C (HMGIC), lactate dehydrogenase B (LDHB), and glyceraldehyde-3-phosphate dehydrogenase (GAPD).
The PPARA gene is located on human chromosome 22, whereas the other 4 genes are located on human chromosome 12. The PPARA protein is a nuclear transcription factor and belongs to the steroid hormone receptor superfamily called PPAR. Studies with human and mouse have indicated the important role of the PPARA protein in lipid homeostasis and the protection against obesity (Costet et al., 1998; Tai et al., 2002; Yamakawa-Kobayashi et al., 2002). Also, in the chicken an association has been described between a polymorphism in the PPARA gene and fatness traits (Meng et al., 2002). The IGF-I and HMGIC proteins, directly involved in the regulation of growth, play a role in obesity and fat deposition in the human and mouse (Sun et al., 1999; Anand and Chada, 2000; PeLrusse et al., 2001). The LDHB and GAPD proteins catalyze reactions in glycolysis and gluconeogenesis. These metabolic pathways yield intermediates that are important for the fat metabolism. Therefore, LDHB and GAPD could influence fat storage. However, no association has yet been found with obesity or other fat traits.
Another chicken chromosome showing conservation of synteny to parts of human chromosomes 12 and 22 is chicken chromosome 15 (Jennen et al., 2003). Potential candidate genes mapped on chromosome 15 are X-box binding protein 1 (XBP1), phosphotidylinositol transfer protein-â (PITPNB) and T-box 3 (TBX3). The XBP1 and PITPNB genes are located on human chromosome 22, and the TBX3 gene is located on human chromosome 12. The XBP1 and TBX3 proteins are transcription factors involved in cell differentiation, whereas the PITPNB protein is able to transfer phospholipids between membranes. Whether these proteins are actually involved in the fat regulation is unknown. So far no association has been found with obesity or any other fat trait.
In conclusion, although it is tempting to look for potential candidate genes, one should be aware that the QTL have not yet been precisely localized. At present the number of identified genes (Schmid et al., 2000) is too limited to be able to align the chicken and human genetic maps accurately. Nevertheless, for several chicken chromosomes containing a QTL, detailed comparative maps between human and chicken have been published recently (Crooijmans et al., 2001; Buitenhuis et al. 2002; Jennen et al., 2003). Furthermore, the draft sequence of the chicken genome is expected to be completed by the end of the year 2003, which will increase the ability to align the chicken and human maps and consequently increase the chance to identify potential candidate genes.
ACKNOWLEDGMENTS
The authors thank J. A. M. van Arendonk and P. Bijma for valuable discussions regarding quantitative genetics. Furthermore, the authors acknowledge Nutreco, Breeding Research Center for their collaboration and financial support. This work was financially supported by the Netherlands Technology Foundation (STW; grant WBI.4706).
REFERENCES
Anand, A., and K. Chada. 2000. In vivo modulation of HMGIC reduces obesity. Nat. Genet. 24:377–380.
Buitenhuis A. J., R. P. M. A. Crooijmans, E. S. Bruijnesteijn van Coppenraet, A. Veenendaal, M. A. M. Groenen, and J. J. van der Poel. 2002. Improvement of the comparative map of chicken chromosome 13. Anim. Genet. 33:249–254.
Carlborg,O¨ ., S. Kerje, K. Schu¨ tz, L. Jacobsson, P. Jensen, and L. Andersson. 2003. A global search reveals epistatic interaction between QTL for early growth in the chicken. Genome Res. 13:413–421.
Churchill, G. A., and R. W. Doerge. 1994. Emperical threshold values for quantitative trait mapping. Genetics 138:963–971. Costet, P., C. Legendres, J. More, A. Edgar, P. Galtier, and T. Pineau. 1998. Peroxisome proliferator-activated receptor aisoform deficiency leads to progressive dyslipidemia with sexually dimorphic obesity and steatosis. J. Biol. Chem. 273:29577–29585.
Crooijmans, R. P. M. A., R. J. M. Dijkhof, J. J. van der Poel, and M. A. M. Groenen. 1997. New microsatellite markers in chicken optimized for automated fluorescent genotyping. Anim Genet. 28:427–437.
Crooijmans, R. P. M. A., R. J. M. Dijkhof, T. Veenendaal, J. J. van der Poel, R. D. Nicholls, H. Bovenhuis, and M. A. M. Groenen. 2001. The gene orders on human chromosome 15 and chicken chromosome 10 reveal multiple inter- and intrachromosomal rearrangements. Mol. Biol. Evol. 18:2102–2109
Green, P., K. Falls, and S. Crooks. 1990. Documentation for Cri- MAP Version 2.4 (3/26/90). Washington University School of Medicine, St. Louis, Missouri.
Griffin, H. 1996. Understanding genetic variation in fatness in chickens. Pages 35–38 in Annual Report 95/96. Roslin Institute, Edinburgh, UK.
Groenen, M. A. M., R. P. M. A. Crooijmans, A. Veenendaal, H. H. Cheng, M. Siwek, and J. J van der Poel. 1998.Acomprehensive microsatellite linkage map of the chicken genome. Genomics 49:265–274.
Haldane, J. B. S. 1919. The combination of linkage values and the calculation of distances between the loci of linked factors. J. Genet. 2:3–19.
Ikeobi, C. O. N., J. A. Woolliams, D. R. Morrice, A. Law, D. Windsor, D. W. Burt, and P. M. Hocking. 2002. Quantitative trait loci affecting fatness in the chicken. Anim. Genet. 33:428–435.
Jennen, D. G. J., R. P. M. A. Crooijmans, B. Kamps, R. Ac¸ar, J. J. van der Poel, and M. A. M. Groenen. 2003. Comparative Map between chicken chromosome 15 and human chromosomal region 12q24 and 22q11-q12. Mamm. Genome 14:629–639.
Lander, E. S., and L. Kruglyak. 1995. Genetic dissection of complex traits: Guidelines for interpreting and reporting linkage results. Nat. Genet. 11:241–247.
Le Bihan-Duval, E., C. Berri, E. Baeza, N. Millet, and C. Beaumont. 2001. Estimation of the genetic parameters of meat characteristics and of their genetic correlations with growth and body composition in an experimental broiler line. Poult. Sci. 80:839–843.
Le Bihan-Duval, E., N. Millet, and H. Remignon. 1999. Broiler meat quality: effect of selection for increased carcass quality and estimates of genetic parameters. Poult. Sci. 78:822–826.
Mallard, J., and M. Douaire. 1988. Strategies of selection for leanness in meat production. Pages 3–23 in Leanness in Domestic Birds: Genetic, Metabolic and Hormonal Aspects. B. Leclerq and C. C. Whitehead, ed. Butterworths, Essex, UK.
McElroy, J. P., D. E. Harry, J. C. M. Dekkers, and S. J. Lamont. 2002. Molecular markers associated with growth and carcass traits in meat-type chickens. Communication 04-04 in Proceedings of the 7th World Congress on Genetics Applied to Livestock Production, Montpellier, France. INRA, Cedex, France.
Meng, H., G. H. Wang, Q. G. Wang, J. G. Zhao, Z. L. Gu, Y. X. Wang, and H. Li. 2002. Studies of single nucleotide polymorphism of PPAR gene and its association with fattiness trait in chicken. Yi Chuan Xue Bao 29:119–123. Pe´russe, L., T. Rice, Y. C. Chagnon, J.-P. Despre´s, S. Lemieux, S. Roy, M. Lacaille, M.-A. Ho-Kim, M. Chagnon, M. A. Province, D. C. Rao, and C. Bouchard. 2001. A genome-wide scan for abdominal fat assessed by computed tomography in the Que´bec family study. Diabetes 50:614–621.
Pitel, F., S. Lagarrigue, P. Le Roy, F. Plisson-Petit, Y. Amigues, A. Neau, A. Cahaner, J. Hillel, M. Sourdioux, B. Leclerq, A. Vignal, and M. Douaire. 2002. A two-step procedure for fat QTL identification in meat-type chickens. Communication 04-37 in Proceedings of the 7th World Congress on Genetics Applied to Livestock Production, Montpellier, France. INRA, Cedex, France.
Schmid M., I. Nanda, M. Guttenbach, C. Steinlein, H. Hoehn, M. Schartl, T. Haaf, S. Weigend, R. Fries, J-M. Buerstedde, K. Wimmers, D. W. Burt, J. Smith, S. A’Hara, A. Law, D. K. Griffin, N. Bumstead, J. Kaufman, P. A. Thomson, T. Burke, M. A. M. Groenen, R. P. M. A. Crooijmans, A. Vignal, V. Fillon, M. Morisson, F. Pitel, M. Tixier-Boichard, K. Ladjali- Mohammedi, J. Hillel, A. Ma¨ki-Tanila, H. H. Cheng, M. E. Delany, J. Burnside, and S. Mizuno. 2000. First report on chicken genes and chromosomes 2000. Cytogenet. Cell Genet. 90:169–218.
Schutz, K., S. Kerje, O. Carlborg, L. Jacobsson, L. Andersson, and P. Jensen. 2002. QTL analysis of a red jungle fowl × White Leghorn intercross reveals trade-off in resource allocation between behavior and production traits. Behav. Genet. 32:423–433.
Sewalem, A., D. M. Morrice, A. Law, D. Windsor, C. S. Haley, C. O. N. Ikeobi, D. W. Burt, and P. M. Hocking. 2002. Mapping of quantitative trait loci for body weight at three, six, and nine weeks of age in broiler layer cross. Poult. Sci. 81:1775–1781. Sun, G., J. Gagnon, Y. Chagnon, L. Pe´russe, J. Despres, A. Leon, J. Wilmore, J. Skinner, I. Borecki, D. Rao, and C. Bouchard. 1999. Association and linkage between an insulin-like growth factor-1 gene polymorphism and fat free mass in HERTAGE family study. Int. J. Obes. Relat. Metab. Disord. 23:929–935. Tai, E. S., S. Demissie, L. A. Cupples, D. Corella, P. W. Wilson, E. J. Schaefer, and J. M. Ordovas. 2002. Association between the PPARA L126V polymorphism and plasma lipid levels: the Framingham Offspring Study. Arterioscler. Thromb. Vasc. Biol. 22:805–810.
Tatsuda, K., and K. Fujinaka. 2001a. Genetic mapping of the QTL affecting abdominal fat deposition in chickens. Jpn. Poult. Sci. 38:266–274.
Tatsuda, K., and K. Fujinaka. 2001b. Genetic mapping of the QTL affecting body weight in chickens using a F2 family. Br. Poult. Sci. 42:333–337.
Tuiskula-Haavisto, M., M. Honkatukia, J. Vilkki, D.-J. de Koning, N. F. Schulman, and A. Ma¨ki-Tanila. 2002. Mapping of quantitative trait loci affecting quality and production traits in egg layers. Poult. Sci. 81:919–927.
Van Kaam, J. B. C. H. M., M. A. M. Groenen, H. Bovenhuis, A. Veenendaal, A. L. J. Vereijken, and J. A. M. van Arendonk. 1999a. Whole genome scan in chickens for quantitative trait loci affecting growth and feed efficiency. Poult. Sci. 78:15–23. Van Kaam, J. B. C. H. M., M. A. M. Groenen, H. Bovenhuis, A.
Veenendaal, A. L. J. Vereijken, and J. A. M. van Arendonk. 1999b. Whole genome scan in chickens for quantitative trait loci affecting carcass traits. Poult. Sci. 78:1091–1099.
Van Kaam, J. B. C. H. M., J. A. M. van Arendonk, M. A. M. Groenen, H. Bovenhuis, A. L. J. Vereijken, R. P. M. A. Crooijmans, J. J. van der Poel, and A. Veenendaal. 1998. Whole genome scan for quantitative trait loci affecting body weight in chickens using a three generation design. Livest. Prod. Sci. 54:133–150.
Yamakawa-Kobayashi, K., H. Ishiguro, T. Arinami, R. Miyazaki, and H. Hamaguchi. 2002. A Val227Ala polymorphism in the peroxisome proliferator activated receptor alpha (PPARalpha) gene is associated with variations in serum lipid levels. J. Med. Genet. 39:189–191.
Yonash, N., L. D. Bacon, R. L. Witter, and H. H. Cheng. 1999. High resolution mapping and identification of new quantitative trait loci (QTL) affecting susceptibility to Marek’s disease. Anim. Genet. 30:126–135.
Zhu, J. J., H. S. Lillehoj, P. C. Allen, C. P. Van Tassell, T. S. Sonstegard, H. H. Cheng, D. Pollock, M. Sadjadi, W. Min, and M. G. Emara. 2003. Mapping quantitative trait loci associated with resistance to coccidiosis and growth. Poult. Sci. 82:9–16.
August 2006


