

GLOBAL POULTRY TRENDS 2013: Growth in European Egg Production is Outside the EU
Europe's contribution to global egg production is declining but output within the region is growing, particularly in Russia and Ukraine, according to industry analyst, Terry Evans.Although hen egg production in Europe between 2000 and 2012 increased by 1.1 million tonnes from 9.5 million tonnes to 10.6 million tonnes, the rate of growth was less than one per cent per year.
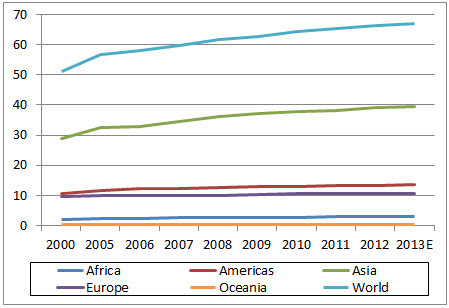
The rise globally during this period was more than double this at 2.2 per cent, output climbing from 51.1 million tonnes to 66.4 million tonnes (Table 1 and Figure 1). Hence, Europe’s contribution to the world total has declined from 18.6 per cent to 16.0 per cent.
| Table 1. World hen egg production (million tonnes) | ||||||||||
| 2000 | 2005 | 2006 | 2007 | 2008 | 2009 | 2010 | 2011 | 2012 | 2013E | |
|---|---|---|---|---|---|---|---|---|---|---|
| Africa | 1.9 | 2.2 | 2.3 | 2.5 | 2.6 | 2.5 | 2.8 | 2.9 | 3.0 | 3.0 |
| Americas | 10.5 | 11.7 | 12.3 | 12.3 | 12.5 | 12.8 | 13.0 | 13.3 | 13.3 | 13.6 |
| Asia | 29.0 | 32.6 | 32.9 | 34.5 | 36.2 | 37.0 | 37.7 | 38.1 | 39.2 | 39.4 |
| Europe | 9.5 | 9.9 | 10.1 | 10.0 | 10.1 | 10.3 | 10.5 | 10.6 | 10.6 | 10.7 |
| Oceania | 0.2 | 0.2 | 0.2 | 0.2 | 0.2 | 0.2 | 0.3 | 0.3 | 0.3 | 0.3 |
| WORLD | 51.1 | 56.6 | 57.9 | 59.6 | 61.7 | 62.8 | 64.2 | 65.2 | 66.4 | 67.0 |
| E, estimate Source: FAO to 2012, 2013 are author's estimates |
||||||||||

While production in the European Union (EU) was virtually static during these years (Table 2), output in the non-EU countries expanded by almost 2.8 per cent per year from 2.8 million tonnes to 3.9 million tonnes and will currently be well above four million tonnes.
| Table 2. Hen egg production in Europe ('000 tonnes) | |||||||
| Country | 2000 | 2005 | 2008 | 2009 | 2010 | 2011 | 2012 |
|---|---|---|---|---|---|---|---|
| Albania | 21.0 | 27.3 | 29.7 | 30.0 | 31.3 | 31.8 | 32.8 |
| Austria | 86.1 | 89.3 | 96.2 | 92.0 | 94.6 | 102.7 | 106.0 |
| Belarus | 182.3 | 172.4 | 183.7 | 190.3 | 198.1 | 204.3 | 215.0 |
| Belgium | 194.2 | 179.8 | 161.0 | 152.6 | 157.5 | 161.0 | 165.0 |
| Bosnia/Herzegovina | 18.2 | 17.6 | 26.2 | 23.6 | 20.8 | 18.3 | 23.0 |
| Bulgaria | 82.1 | 97.0 | 93.7 | 88.7 | 89.3 | 73.5 | 71.9 |
| Croatia | 46.5 | 49.4 | 47.2 | 48.3 | 42.3 | 41.5 | 35.1 |
| Czech Rep. | 188.0 | 145.9 | 158.8 | 155.0 | 127.5 | 130.1 | 115.0 |
| Denmark | 74.3 | 79.8 | 81.0 | 73.9 | 76.4 | 78.6 | 78.0 |
| Estonia | 15.8 | 13.1 | 9.2 | 10.8 | 11.4 | 11.4 | 11.1 |
| Finland | 58.5 | 58.2 | 58.3 | 53.9 | 61.5 | 62.8 | 62.2 |
| France | 1,038.0 | 930.1 | 801.3 | 876.0 | 905.6 | 839.5 | 853.6 |
| Germany | 901.0 | 795.0 | 789.6 | 699.0 | 662.4 | 782.3 | 832.0 |
| Greece | 116.6 | 110.1 | 101.8 | 108.8 | 99.8 | 100.0 | 102.0 |
| Hungary | 176.4 | 164.7 | 159.9 | 155.9 | 151.8 | 136.6 | 131.1 |
| Iceland | 2.6 | 2.8 | 2.9 | 3.0 | 2.7 | 3.4 | 2.7 |
| Ireland | 32.4 | 37.5 | 41.2 | 41.6 | 45.0 | 46.0 | 46.5 |
| Italy | 686.1 | 722.2 | 750.0 | 812.5 | 736.8 | 755.0 | 765.0 |
| Latvia | 24.4 | 33.4 | 40.3 | 42.9 | 45.0 | 41.9 | 42.3 |
| Lithuania | 41.5 | 51.9 | 54.8 | 47.8 | 46.4 | 43.8 | 43.5 |
| Luxembourg | 1.0 | 1.3 | 1.3 | 1.3 | 1.4 | 1.5 | 1.5 |
| Macedonia Rep. | 25.5 | 19.0 | 15.5 | 15.4 | 18.8 | 16.6 | 13.3 |
| Malta | 5.4 | 5.9 | 8.2 | 7.0 | 5.1 | 4.5 | 3.9 |
| Moldova Rep. | 32.0 | 42.5 | 31.4 | 35.8 | 40.2 | 39.3 | 34.8 |
| Montenegro | - | - | 2.7 | 2.8 | 3.2 | 3.8 | 3.9 |
| Netherlands | 668.0 | 607.0 | 627.0 | 638.0 | 670.0 | 692.0 | 672.0 |
| Norway | 46.9 | 50.7 | 56.0 | 58.9 | 59.6 | 58.8 | 61.9 |
| Poland | 423.8 | 536.0 | 581.7 | 605.0 | 637.0 | 587.0 | 530.2 |
| Portugal | 117.4 | 118.2 | 123.5 | 124.2 | 131.1 | 122.8 | 120.5 |
| Romania | 262.8 | 355.4 | 333.6 | 297.3 | 297.5 | 304.3 | 311.7 |
| Russian Federation | 1,894.6 | 2,049.9 | 2,118.5 | 2,194.5 | 2,260.6 | 2,283.6 | 2,333.6 |
| Serbia | - | - | 60.2 | 59.0 | 69.5 | 69.5 | 79.1 |
| Slovakia | 60.8 | 62.9 | 71.3 | 70.6 | 74.7 | 74.7 | 74.6 |
| Slovenia | 22.7 | 14.3 | 19.4 | 21.5 | 21.6 | 21.4 | 22.2 |
| Spain | 657.6 | 708.5 | 812.4 | 829.5 | 812.5 | 818.8 | 693.0 |
| Sweden | 102.0 | 102.0 | 102.0 | 105.0 | 111.0 | 116.0 | 120.0 |
| Switzerland | 36.3 | 37.9 | 39.3 | 43.5 | 45.3 | 45.6 | 46.1 |
| Ukraine | 496.6 | 748.1 | 855.2 | 883.8 | 973.9 | 1,064.2 | 1,092.8 |
| United Kingdom | 568.6 | 609.0 | 600.1 | 603.0 | 658.0 | 653.0 | 630.0 |
| EUROPEAN UNION | 6,662.4 | 6,687.0 | 6,734.8 | 6,771.9 | 6,781.8 | 6,810.8 | 6,648.3 |
| EUROPE | 9,479.8 | 9,922.4 | 10,146.1 | 10,302.7 | 10,497.1 | 10,641.7 | 10,578.7 |
| WORLD | 51,046.2 | 56,614.2 | 61,699.6 | 62,794.0 | 64,202.8 | 65,233.6 | 66,372.6 |
| - no figure Source: FAO |
|||||||
While there was little growth of less than 0.2 per cent per year in the EU to 2011, 2012 witnessed a cut-back to the 2000 level and although, according to European Commission figures, 2013 saw a rise of around one per cent, the data for the first four months of 2014 suggest a fall of almost four per cent. Hence, further growth is needed in the non-EU European countries if Europe’s contribution to the global total is not to slip below 16 per cent.
While the total number of layers in Europe expanded by some 110 million or nearly 16 per cent between 2000 and 2012 reaching a record 810 million, those kept in EU member countries went up by just 10 million or 1.6 per cent to nearly 500 million.
Of the increase in output from non-EU European countries amounting to 1.1 million tonnes between 2000 and 2012, some 93 per cent was accounted for by just two countries - Ukraine with 596,000 tonnes and the Russian Federation with 439,000 tonnes. Indeed, the Russian Federation and the Ukraine are the two largest egg producers in Europe (Table 3) and together, they produced close to 3.5 million tonnes or one-third of the regional total in 2012.
| Table 3. Egg production ranking in Europe in 2012 ('000 tonnes) | |
| Country | ('000 tonnes) |
|---|---|
| Russian Federation | 2,333.6 |
| Ukraine | 1,092.8 |
| France | 853.6 |
| Germany | 832.0 |
| Italy | 765.0 |
| Spain | 693.0 |
| Netherlands | 672.0 |
| United Kingdom | 630.0 |
| Poland | 530.2 |
| Romania | 311.7 |
| Belarus | 215.0 |
| Belgium | 165.0 |
| Hungary | 131.1 |
| Portugal | 120.5 |
| Sweden | 120.0 |
| Czech Rep. | 115.0 |
| Austria | 106.0 |
| Greece | 102.0 |
| Serbia | 79.1 |
| Denmark | 78.0 |
| Slovakia | 74.6 |
| Bulgaria | 71.9 |
| Finland | 62.2 |
| Norway | 61.9 |
| Ireland | 46.5 |
| Switzerland | 46.1 |
| Lithuania | 43.5 |
| Latvia | 42.3 |
| Croatia | 35.1 |
| Moldova Rep. | 34.8 |
| Albania | 32.8 |
| Bosnia/Herzegovina | 23.0 |
| Slovenia | 22.2 |
| Macedonia Rep. | 13.3 |
| Estonia | 11.1 |
| Malta | 3.9 |
| Montenegro | 3.9 |
| Iceland | 2.7 |
| Luxembourg | 1.5 |
| Source FAO | |
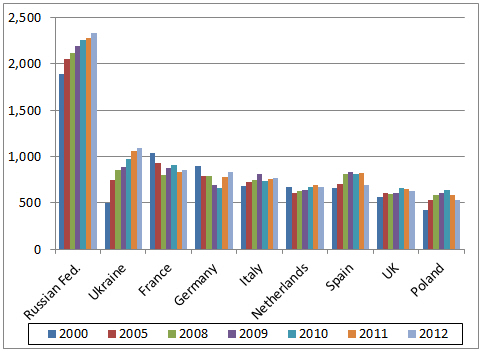
The leading nine countries, each producing more than 500,000 tonnes a year had, in 2011, a combined output of 8.5 million tonnes although this slipped a shade to 8.4 million tonnes in 2012 or 79 per cent of the Europe total. This compared with 7.3 million tonnes or 77 per cent back in 2000 (Table 4 and Figure 2). Figure 2 demonstrates how rapidly the egg industries in Russia and the Ukraine have expanded while production among the other key countries hardly grew during the review period. Indeed, output in France in 2012 was some 18 per cent below the 2000 level.

Having benefited from government support to counter rising electricity, fuel and feed costs, the egg industry in Russia expanded by 1.8 per cent per year to 2012. Nevertheless, many egg facilities are considered to be in poor condition with out-of-date equipment.
It is considered that there are about 450 large egg farms of which, in 2012, only 150 were considered to be operating at full capacity. Some 160 were thought to be working at 50 per cent while the remainder were operating at 30 per cent or less.
All the birds are housed in cages with the split between those producing white- and brown-shelled eggs at roughly 50:50.
Low profitability is a major problem and is considered to dampen future industry growth. Disappointing profits could lead to greater interest in egg processing as currently only seven per cent of eggs are used in this way compared with more than 20 per cent in EU countries.
| Table 4. Leading egg producers in Europe ('000 tonnes) | |||||||
| Country | 2000 | 2005 | 2008 | 2009 | 2010 | 2011 | 2012 |
|---|---|---|---|---|---|---|---|
| Russian Federation | 1,894.6 | 2,049.9 | 2,118.5 | 2,194.5 | 2,260.6 | 2,283.6 | 2,333.6 |
| Ukraine | 496.6 | 748.1 | 855.2 | 883.8 | 973.9 | 1,064.2 | 1,092.8 |
| France | 1,038.0 | 930.1 | 801.3 | 876.0 | 905.6 | 839.5 | 853.6 |
| Germany | 901.0 | 795.0 | 789.6 | 699.0 | 662.4 | 782.3 | 832.0 |
| Italy | 686.1 | 722.2 | 750.0 | 812.5 | 736.8 | 755.0 | 765.0 |
| Netherlands | 668.0 | 607.0 | 627.0 | 638.0 | 670.0 | 692.0 | 672.0 |
| Spain | 657.6 | 708.5 | 812.4 | 829.5 | 812.5 | 818.8 | 693.0 |
| United Kingdom | 568.6 | 609.0 | 600.1 | 603.0 | 658.0 | 653.0 | 630.0 |
| Poland | 423.8 | 536.0 | 581.7 | 605.0 | 637.0 | 587.0 | 530.2 |
| Total above | 7,334.3 | 7,705.8 | 7,935.8 | 8,141.3 | 8,316.8 | 8,475.4 | 8,402.2 |
| EUROPE | 9,479.8 | 9,922.4 | 10,146.1 | 10,302.7 | 10,497.1 | 10,641.7 | 10,578.7 |
| Source FAO | |||||||
The egg sector in Ukraine has expanded rapidly, growth having averaged almost seven per cent per year during the 12 years to 2012 when production reached a record near 1.1 million tonnes. All birds are housed in cages. During the first half of 2013, egg output rose by four per cent.
Egg production in France plummeted by some 23 per cent between 2000 and 2008 from 1.04 million tonnes to around 800,000 tonnes. Since then, the industry has recovered somewhat but it must be remembered that the FAO figures include hatching eggs for both the layer and chicken meat industries.
Data supplied by the International Egg Commission puts table egg output in 2012 at 721,000 tonnes compared with 784,000 tonnes in 2011 and 875,000 tonnes in 2010. Some 70 per cent of the flock are kept in a cage system, with 24 per cent on free range. The corresponding figures for 2009 were 82 per cent and 15 per cent. About 85 per cent of eggs are brown-shelled. Almost 28 per cent are processed.
A ban on conventional battery cages came into force in Germany in January 2010 - two years ahead of the rest of the EU. As a result, production contracted sharply by 16 per cent between 2008 and 2010. Another consequence of the change in housing systems has been that in 2012, only 13 per cent of layers were in cages (colony cages) with 23 per cent on free range while 64 per cent were housed in barn systems. The corresponding figures in 2009 were 38, 18 and 44 per cent.
With production contracting sharply to a low in 2010, the industry’s level of self-sufficiency declined to 57.4 per cent. However, since then, a recovery has set in, bringing the level of self-sufficiency back up to the 2008 figure of almost 72 per cent.
Despite the annual fluctuations, egg production in The Netherlands in 2012 was little changed from 2000. However, back then, when total output was around 10 billion eggs, 7.7 billion came from cages. By 2012, this figure, which included eggs from enriched cages, had slumped to 1.8 billion. In contrast, the quantity of eggs coming from other housing systems rocketed from 2.3 to 8.4 billion.
Over the review period, the egg sector in Italy increased little with growth averaging less than one per cent per year. Barn systems have grown in popularity at the expense of cage production. In 2009, almost 85 per cent of the flock was in cages and eight per cent in barns but by 2012, cages accounted for 58 per cent of birds and barns 40 per cent.
From 2000 to 2009, egg production in Spain expanded by 2.6 per cent per year to reach 830,000 tonnes. However, it has since contracted somewhat though the cut-back, according to IEC figures, has not been nearly as sharp as indicated by the FAO data.
Egg output in the United Kingdom has declined in recent years. Currently, production is spread 50:50 between cages (enriched) and free-range with barns accounting for less than four per cent of the total.
Although the egg industry in Poland recorded good growth to 2010, it has since reacted to economic pressures by curbing production. Some 84 per cent of birds are in cages, 14 per cent in barns with two per cent on free range.
May 2014


