GLOBAL POULTRY TRENDS 2014: Asia: Biggest Exporter of Processed Chicken
Asia is the region that exports the most processed chicken products, according to poultry industry analyst, Terry Evans. 10 September 2014
 11 minute read
 By:
By: Global trade in fresh/frozen chicken meat escalated rapidly between 2000 and 2011 to reach 12.5 million tonnes (Table 1) although this likely exaggerates the true picture since much of the exports from Hong Kong will be re-exports from Brazil and the USA, already accounted for in the figures for the Americas.
| Table 1. World trade in fresh/frozen and prepared/processed chicken meat ('000 tonnes) | ||||||||
| Country | 2000 | 2005 | 2006 | 2007 | 2008 | 2009 | 2010 | 2011 |
|---|---|---|---|---|---|---|---|---|
| World trade in fresh/frozen chicken meat ('000 tonnes): | ||||||||
| Exports: | ||||||||
| Africa | 9.5 | 4.8 | 3.0 | 6.5 | 9.5 | 46.2 | 61.5 | 56.2 |
| Americas | 3,627.4 | 5,516.0 | 5,445.3 | 6,366.4 | 7,311.6 | 7,234.9 | 7,252.7 | 7,530.4 |
| Asia | 1,432.2 | 420.6 | 482.9 | 639.1 | 765.8 | 876.2 | 1,187.7 | 1,373.1 |
| Europe | 1,805.1 | 2,137.3 | 2,157.6 | 2,302.6 | 2,344.7 | 2,592.1 | 3,115.7 | 3,477.8 |
| Oceania | 14.3 | 21.8 | 20.7 | 28.2 | 31.0 | 33.3 | 29.2 | 32.8 |
| World | 6,888.4 | 8,100.6 | 8,109.5 | 9,342.9 | 10,462.6 | 10,782.7 | 11,646.8 | 12,470.2 |
| Imports: | ||||||||
| Africa | 259.0 | 512.9 | 612.3 | 673.6 | 717.8 | 861.2 | 1,065.5 | 1,254.4 |
| Americas | 556.0 | 910.5 | 1,033.4 | 1,132.3 | 1,373.7 | 1,380.3 | 1,416.6 | 1,509.8 |
| Asia | 3,276.7 | 2,767.2 | 2,976.2 | 3,654.0 | 4,274.9 | 4,670.9 | 5,021.5 | 5,780.0 |
| Europe | 1,811.2 | 3,223.6 | 3,094.2 | 3,171.0 | 3,374.2 | 3,095.0 | 2,879.7 | 2,790.3 |
| Oceania | 26.4 | 35.5 | 32.4 | 35.6 | 37.9 | 42.6 | 47.0 | 57.0 |
| World | 5,929.3 | 7,449.8 | 7,748.4 | 8,666.5 | 9,778.5 | 10,050.0 | 10,430.4 | 11,391.5 |
| World trade in prepared/processed chicken meat: | ||||||||
| Exports: | ||||||||
| Africa | 1.8 | 2.1 | 2.7 | 3.3 | 1.4 | 1.0 | 0.8 | 0.7 |
| Americas | 92.9 | 270.2 | 335.7 | 381.9 | 427.1 | 418.5 | 427.6 | 424.8 |
| Asia | 212.4 | 515.8 | 554.0 | 606.5 | 599.3 | 603.0 | 700.8 | 814.6 |
| Europe | 260.8 | 432.7 | 453.9 | 551.9 | 635.0 | 680.3 | 694.8 | 746.3 |
| Oceania | 2.2 | 1.8 | 1.1 | 0.6 | 1.0 | 1.8 | 2.9 | 3.4 |
| World | 570.1 | 1,222.6 | 1,347.3 | 1,544.2 | 1,663.8 | 1,704.5 | 1,827.0 | 1,989.7 |
| Imports: | ||||||||
| Africa | 1.9 | 7.0 | 6.8 | 8.7 | 8.9 | 7.3 | 7.7 | 10.7 |
| Americas | 67.8 | 90.6 | 103.2 | 119.4 | 127.4 | 122.4 | 137.0 | 154.8 |
| Asia | 186.7 | 389.6 | 423.9 | 448.3 | 412.6 | 429.4 | 538.2 | 648.9 |
| Europe | 304.3 | 677.6 | 717.8 | 804.1 | 932.2 | 948.0 | 1,009.2 | 1,075.0 |
| Oceania | 1.3 | 2.0 | 2.7 | 3.2 | 4.1 | 5.4 | 8.9 | 10.0 |
| World | 561.8 | 1,166.8 | 1,254.4 | 1,383.6 | 1,485.2 | 1,512.4 | 1,701.0 | 1,899.4 |
| Source: FAO | ||||||||
To get the complete export picture, however, account needs to be taken of the trade in prepared/processed chicken meat. The latter has increased as a result of some importing countries imposing bans on shipments of fresh/frozen products from countries that had been hit by avian influenza. As a result, global exports of prepared chicken products have escalated from less than 600,000 tonnes in 2000 to close on two million tonnes in 2011 (bottom half of Table 5). This is equivalent to around 2.9 million tonnes eviscerated weight, making a world total when added to the fresh/frozen figure in the top half of the table, of around 15.5 million tonnes.
Asia is the leading regional exporter of prepared chicken products, shipping more than 800,000 tonnes in 2011, while Europe is the biggest buyer, purchasing more than one million tonnes in that year.
It is apparent from Table 1 that the quantities of frozen and processed chicken exported and imported in a year do not balance. There are many reasons for this, including:
- Some countries provide data on a general rather than specific product basis.
- Data may be presented on a financial or market year rather than a calendar year.
- There is a time lag between product leaving a country in say December and arriving at its destination in say January of the following year.
- There can be a misclassification of a product between the exporter and importer.
- There can be place-of-origin/final destination inconsistencies. For example country (A) may report that the final destination is country C, but the goods actually reach C via another country (B). As a result country C may report the place of origin of the goods was country B.
- Goods can be lost during transport, while occasionally differences can occur due to a typing or calculation error, and
- In some instances, exports may not be declared to circumvent an embargo or avoid tax payments.
Although the quantities of fresh/frozen chicken exported from Asia have risen in recent years, the total in 2011 was no higher than in 2000. It is on the import side of the trade statistics that Asia features strongly as it is easily the most important region acquiring some 5.8 million tonnes in 2011 compared with 3.3 million tonnes in 2000 (Table 1 and Figure 1).

Chicken Meat Imports by Asian Countries
While Hong Kong SAR is the largest importer of fresh/frozen chicken meat in Asia - taking almost 1.2 million tonnes in 2011 (Table 2), more than 750,000 tonnes were re-exported, of which, some 625,000 tonnes went to Viet Nam. Of Hong Kong’s imports, some 528,000 tonnes were purchased from the US and 324,000 tonnes from Brazil.
| Table 2. Imports of fresh/frozen chicken meat into Asia (tonnes) | |||||||
| Country | 2000 | 2005 | 2007 | 2008 | 2009 | 2010 | 2011 |
|---|---|---|---|---|---|---|---|
| Afghanistan | 25 | 23,192 | 11,342 | 32,316 | 23,056 | 38,591 | 51,004 |
| Armenia | 13,780 | 12,878 | 26,155 | 36,044 | 27,234 | 35,475 | 37,257 |
| Azerbaijan | 13,100 | 4,268 | 8,040 | 12,094 | 11,393 | 12,776 | 15,047 |
| Bahrain | 18,182 | 28,399 | 24,671 | 28,351 | 28,545 | 36,148 | 35,307 |
| Bangladesh | 0 | 52 | 22 | 1 | 0 | 0 | 0 |
| Bhutan | 20 | 0 | 0 | 145 | 163 | 384 | 255 |
| Brunei Darussalam | 920 | 214 | 241 | 175 | 721 | 447 | 877 |
| Cambodia | 71 | 2 | 1 | 228 | 418 | 178 | 332 |
| China, mainland | 7,899,742 | 370,418 | 773,300 | 787,196 | 722,242 | 515,536 | 385,498 |
| China, Hong Kong SAR | 993,778 | 455,394 | 537,860 | 653,408 | 715,341 | 1,011,178 | 1,176,978 |
| China, Macao SAR | 4,883 | 7,200 | 10,031 | 11,261 | 11,023 | 11,451 | 12,159 |
| China, Taiwan | 12,250 | 79,944 | 102,286 | 182,769 | 260,077 | 110,314 | 108,039 |
| Cyprus | 35 | 1,796 | 3,403 | 4,583 | 4,742 | 5,743 | 5,958 |
| Georgia | 16,386 | 16,218 | 26,588 | 36,012 | 38,254 | 39,558 | 43,963 |
| India | 0 | 0 | 23 | 0 | 0 | 0 | 0 |
| Indonesia | 14,017 | 3,817 | 4,735 | 5,294 | 2,687 | 125 | 9 |
| Iran Isl. Rep. | 22,656 | 0 | 25,067 | 25,484 | 25,484 | 29,719 | 64,569 |
| Iraq | 0 | 30,887 | 126,188 | 174,435 | 319,700 | 262,543 | 371,978 |
| Japan | 568,272 | 419,119 | 351,779 | 426,092 | 331,091 | 420,253 | 471,841 |
| Jordan | 363 | 11,911 | 24,283 | 41,697 | 39,363 | 46,953 | 47,117 |
| Kazakhstan | 19,885 | 108,656 | 146,312 | 131,748 | 108,120 | 100,000 | 156,756 |
| Korea Rep. | 66,082 | 46,520 | 44,875 | 57,881 | 61,782 | 92,881 | 116,849 |
| Kuwait | 57,972 | 161,855 | 143,416 | 191,942 | 220,729 | 184,506 | 159,397 |
| Kyrgyzstan | 1,970 | 11,812 | 22,287 | 40,325 | 18,901 | 86,804 | 72,825 |
| Lao Peo. Dem. Rep. | 8 | 7 | 10 | 0 | 0 | 0 | 0 |
| Lebanon | 3 | 380 | 194 | 2,016 | 6,392 | 8,829 | 3,719 |
| Malaysia | 29,876 | 17,133 | 32,582 | 31,705 | 27,783 | 36,097 | 39,822 |
| Maldives | 1,200 | 3,866 | 5,203 | 4,073 | 4,565 | 6,175 | 6,847 |
| Mongolia | 18 | 438 | 1,072 | 1,817 | 1,498 | 4,479 | 5,210 |
| Myanmar | 5 | 0 | 79 | 33 | 2,259 | 3,279 | 558 |
| Nepal | 0 | 50 | 4 | 1 | 0 | 196 | 313 |
| Occ. Palestinian Terr. | 3,958 | 9,000 | 5,300 | 8,200 | 9,400 | 11,000 | 8,400 |
| Oman | 24,566 | 51,927 | 57,540 | 75,500 | 134,911 | 74,126 | 90,060 |
| Pakistan | 0 | 0 | 13 | 6 | 0 | 5 | 6 |
| Philippines | 17,519 | 26,288 | 38,355 | 43,758 | 61,463 | 98,005 | 111,855 |
| Qatar | 23,905 | 25,534 | 33,446 | 44,423 | 67,881 | 51,992 | 74,720 |
| Saudi Arabia | 276,467 | 450,842 | 438,810 | 454,234 | 554,709 | 645,012 | 737,263 |
| Singapore | 83,887 | 91,228 | 103,213 | 104,089 | 99,029 | 104,665 | 111,714 |
| Sri Lanka | 1,321 | 1,580 | 3,377 | 1,940 | 844 | 841 | 1,891 |
| Syrian Arab Rep. | 0 | 127 | 2,076 | 1,079 | 20 | 2,845 | 8,581 |
| Tajikstan | 415 | 9,616 | 19,975 | 24,585 | 24,066 | 235,568 | 23,773 |
| Thailand | 22 | 11 | 16 | 23 | 24 | 310 | 1,162 |
| Timor-Leste | 4,100 | 4,500 | 4,500 | 4,500 | 4,500 | 4,500 | 4,617 |
| Turkey | 0 | 143 | 58 | 637 | 1,142 | 446 | 539 |
| Turkmenistan | 4,700 | 1,317 | 325 | 6,683 | 5,650 | 2,000 | 588 |
| United Arab Emirates | 110,900 | 170,336 | 240,243 | 274,446 | 311,669 | 285,569 | 319,366 |
| Uzbekistan | 9,167 | 6,475 | 3,349 | 3,638 | 3,222 | 4,758 | 11,089 |
| Viet Nam | 50 | 5,373 | 156,198 | 235,209 | 269,783 | 506,971 | 802,233 |
| Yemen | 60,196 | 101,441 | 95,155 | 72,862 | 109,059 | 104,280 | 81,683 |
| ASIA | 3,276,672 | 2,767,164 | 3,653,998 | 4,274,938 | 4,670,935 | 5,021,511 | 5,780,024 |
| Source: FAO | |||||||
Second largest importer in the region in 2011 was Viet Nam taking more than 800,000 tonnes.
Third in this import league table was Saudi Arabia buying nearly 740,000 tonnes of which 574,000 tonnes were supplied by Brazil and 146,000 tonnes by France. By 2023, it is forecast that Saudi Arabia will import more than one million tonnes a year.
Imports of fresh/frozen chicken to Japan are significant, amounting to 472,000 tonnes in 2011 of which 413,000 tonnes came from Brazil. However, in addition, Japan purchased some 428,000 tonnes of prepared chicken products, of which 220,000 tonnes came from China and 204,000 tonnes from Thailand. So, her total imports will have amounted to more than one million tonnes on a ready-to-cook basis. The current view is that this picture will change little in the future.
FAO data shows that imports of fresh/frozen chicken into Iraq escalated from around 31,000 tonnes in 2005 to 372,000 tonnes in 2011 (Table 2).
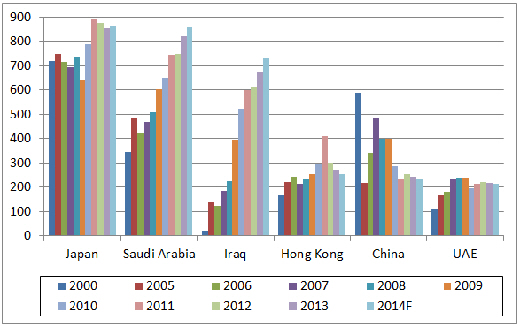
As mentioned in previous reports, production and trade data can vary according to source although in some cases the data are not directly comparable. USDA data, which includes prepared chicken, puts the 2011 figure at 598,000 tonnes with an estimate for 2014 of 730,000 tonnes (Table 3 and Figure 2). The figures for Hong Kong in this table have discounted re-exports from this country.
| Table 3. Leading broiler meat importers in Asia ('000 tonnes) | |||||||||||
| 2000 | 2005 | 2006 | 2007 | 2008 | 2009 | 2010 | 2011 | 2012 | 2013 | 2014F | |
|---|---|---|---|---|---|---|---|---|---|---|---|
| Japan | 721 | 748 | 716 | 696 | 737 | 645 | 789 | 895 | 877 | 854 | 865 |
| Saudi Arabia | 347 | 485 | 423 | 470 | 510 | 605 | 652 | 745 | 750 | 820 | 860 |
| Iraq | 21 | 139 | 124 | 186 | 227 | 397 | 522 | 598 | 612 | 673 | 730 |
| Hong Kong | 168 | 222 | 243 | 215 | 236 | 253 | 295 | 410 | 300 | 272 | 255 |
| China | 588 | 219 | 343 | 482 | 399 | 401 | 286 | 238 | 254 | 244 | 235 |
| United Arab Emirates | 112 | 167 | 182 | 238 | 240 | 240 | 195 | 213 | 223 | 218 | 214 |
| Total of above | 1,957 | 1,980 | 2,031 | 2,287 | 2,349 | 2,541 | 2,739 | 3,099 | 3,016 | 3,081 | 3,159 |
| Prepared meat is included but chicken paws are not. F = forecast Source: USDA |
|||||||||||
The United Arab Emirates is also an important player with, according to the FAO, receipts amounting to nearly 320,000 tonnes in 2011, some 213,000 tonnes of which were bought from Brazil. More recent figures from a USDA GAIN report indicate that UAE’s imports may have amounted to 370,000 tonnes in 2013 with Brazil supplying 245,000 tonnes.
It is clear from Table 3 and Figure 2 that the expansion in trade to this region is coming from increased purchases by Saudi Arabia and Iraq. Imports into Saudi Arabia have increased almost annually and, according to this USDA data, will likely reach a record 860,000 tonnes in 2014.
Clearly China’s imports are in decline and the USDA figures indicate that this trend has continued into 2014. However, the Chinese government has recently approved five Brazilian plants for exports.
Chicken Meat Exports from Asian Countries
Regarding exports of fresh/frozen chicken meat, until recently Thailand has been the key player but sales slumped after an outbreak of avian influenza which resulted in importing countries imposing a ban on this trade. As a result, Thailand switched to exporting processed chicken. So, although exports of frozen product have increased in recent years, the total in 2011 amounted to only 51,000 tonnes.
Earlier in 2014, however, Japan decided to re-open its market to imports of Thai frozen uncooked chicken, which will likely boost its sales in this sector.
In sharp contrast, exports of Thai’s processed items have increased four-fold to reach 441,000 tonnes in 2011 as against 101,000 tonnes in 2000.
In 2011, Japan was the main buyer of these products, taking 204,000 tonnes followed by the United Kingdom with 135,000 tonnes.
It is anticipated that Thailand’s total chicken meat exports will continue to expand to exceed 900,000 tonnes by the 2020s.
| Table 4. Exports of fresh/frozen chicken meat from Asia (tonnes) | |||||||
| Country | 2000 | 2005 | 2007 | 2008 | 2009 | 2010 | 2011 |
|---|---|---|---|---|---|---|---|
| Azerbaijan | 0 | 0 | 100 | 28 | 0 | 322 | 121 |
| Bahrain | 0 | 482 | 1,638 | 282 | 992 | 1,037 | 355 |
| Brunei Darussalam | 17 | 0 | 0 | 0 | 0 | 0 | 0 |
| China, mainland | 372,678 | 127,630 | 125,281 | 126,199 | 131,642 | 164,698 | 168,243 |
| China, Hong Kong SAR | 775,005 | 167,844 | 329,293 | 388,993 | 461,161 | 695,393 | 761,453 |
| China, Macao SAR | 33 | 15 | 20 | 13 | 20 | 0 | 22 |
| China, Taiwan | 1,004 | 880 | 1,064 | 509 | 2,447 | 3,525 | 3,413 |
| Cyprus | 283 | 68 | 611 | 962 | 958 | 1,305 | 1,019 |
| Georgia | 471 | 795 | 906 | 264 | 172 | 712 | 786 |
| India | 84 | 476 | 576 | 1,000 | 839 | 2,234 | 8,767 |
| Indonesia | 744 | 0 | 82 | 80 | 0 | 78 | 17 |
| Iran Isl. Rep. | 7,211 | 15,150 | 22,815 | 24,679 | 399 | 25,484 | 27,246 |
| Israel | 29 | 0 | 5,998 | 1,536 | 2,316 | 1,055 | 367 |
| Japan | 3,339 | 1,926 | 5,781 | 6,927 | 8,699 | 10,704 | 4,206 |
| Jordan | 0 | 1,909 | 2,618 | 20,000 | 21,802 | 19,231 | 16,472 |
| Kazakhstan | 54 | 149 | 2,933 | 2,498 | 52 | 52 | 10 |
| Korea Rep. | 1,381 | 2,121 | 4,691 | 8,056 | 10,955 | 20,197 | 22,779 |
| Kuwait | 1,178 | 28 | 24 | 24 | 765 | 172 | 457 |
| Lebanon | 201 | 520 | 731 | 679 | 937 | 1,264 | 1,864 |
| Malaysia | 3,023 | 291 | 691 | 2,773 | 4,333 | 7,279 | 7,740 |
| Occ. Palestinian Terr. | 50 | 130 | 220 | 350 | 350 | 350 | 350 |
| Oman | 100 | 7,066 | 4,740 | 9,386 | 31,262 | 12,174 | 11,800 |
| Pakistan | 0 | 3 | 0 | 1 | 0 | 501 | 1,718 |
| Philippines | 7 | 3,861 | 3,585 | 3,267 | 4,529 | 5,505 | 9,900 |
| Qatar | 12 | 248 | 119 | 1,060 | 999 | 999 | 999 |
| Saudi Arabia | 17,220 | 17,371 | 17,951 | 9,875 | 19,030 | 8,336 | 10,972 |
| Singapore | 3,284 | 11,439 | 14,499 | 8,846 | 7,162 | 8,798 | 10,267 |
| Sri Lanka | 51 | 4 | 21 | 206 | 584 | 2,259 | 1,812 |
| Syrian Arab Rep. | 0 | 1 | 850 | 26,813 | 8,779 | 6,673 | 548 |
| Thailand | 240,905 | 4,547 | 19,883 | 23,323 | 25,227 | 33,275 | 51,245 |
| Turkey | 3,659 | 44,317 | 50,832 | 78,519 | 114,166 | 138,395 | 234,148 |
| United Arab Emirates | 130 | 11,317 | 20,360 | 18,567 | 15,528 | 15,283 | 13,883 |
| Viet Nam | 0 | 0 | 24 | 24 | 24 | 292 | 103 |
| Yemen | 0 | 1 | 183 | 78 | 105 | 105 | 31 |
| ASIA | 1,432,153 | 420,589 | 639,120 | 765,817 | 876,234 | 1,187,687 | 1,373,113 |
| Source: FAO | |||||||
As is evident from Tables 4 and 5 and Figure 3, the most dramatic movement in the export market in Asia for fresh/frozen chicken meat has been the emergence of Turkey as a key seller. This country’s exports have rocketed from virtually nil back in 2000 to an estimated 480,000 tonnes in 2014.
| Table 5. Leading exporters of broiler meat in Asia ('000 tonnes) | |||||||||||
| Country | 2000 | 2005 | 2006 | 2007 | 2008 | 2009 | 2010 | 2011 | 2012 | 2013 | 2014F |
|---|---|---|---|---|---|---|---|---|---|---|---|
| Thailand | 310 | 240 | 261 | 296 | 383 | 379 | 432 | 467 | 538 | 504 | 580 |
| China | 464 | 332 | 322 | 358 | 285 | 291 | 379 | 423 | 411 | 420 | 430 |
| Turkey | 2 | 30 | 23 | 26 | 42 | 86 | 110 | 206 | 285 | 362 | 480 |
| Total of above | 776 | 602 | 606 | 680 | 710 | 756 | 921 | 1,096 | 1,234 | 1,286 | 1,490 |
| F = forecast Source: USDA |
|||||||||||
In 2011, the biggest customer was Iraq with 119,000 tonnes, while Viet Nam bought 16,400 tonnes out of the total in that year of 234,000 tonnes.
With the decline in Turkish domestic consumption, exporters are looking to increased exports particularly to Saudi Arabia with an initial target of 100,000 tonnes. Sales to Japan and China are also under consideration.

September 2014