


GLOBAL POULTRY TRENDS 2014: Poultry Set to Become No.1 Meat in Asia
Global poultry meat production is forecast to increase by 1.6 per cent in 2014, according to industry analyst, Terry Evans, in the first part of the 2014 series of Global Poultry Trends, and it is expected to overtake pig meat in 2020. Asia accounts for more than one-third of the world's chicken meat output.In both the short- and long-terms, the prospects for poultry meat, and particularly chicken, producers are good. After a difficult two years, when high feed costs and disease outbreaks applied a brake to the rate of expansion in 2013, growth now appears to be picking up. After recording a 2.7 per cent increase in 2012, the growth in poultry meat output slowed to 1.5 per cent in 2013. The latest estimate for 2014 points to a 1.6 per cent gain.
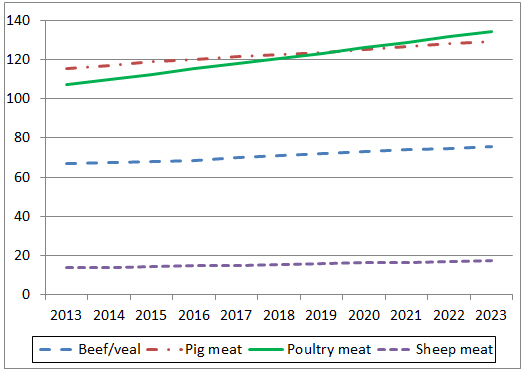
In the longer term, according to an outlook report by the Organisation for Economic Co-operation and Development (OECD) and the Food and Agriculture Organisation of the United Nations (FAO), poultry meat production over the 10 years to 2023 will grow at around 2.3 per cent per year to around 134.5 million tonnes making it the largest meat sector from 2020 onwards (Figure 1).
This compares with annual expansion rates of 1.2 per cent for beef and pig meat, 2.3 per cent for sheep meat and an overall figure for all meats of 1.6 per cent. Hence, poultry meat will account for some 27 million tonnes or more than half of the increase in total meat production of some 53 million tonnes between 2013 and 2023.
Chicken meat represents approximately 88 per cent of global poultry meat output. The FAO estimates that poultry meat production worldwide will amount to around 108.7 million tonnes in 2014, pointing to a chicken meat figure of between 95.5 and 96 million tonnes.
Between 2000 and 2012, the number of chickens slaughtered worldwide rose from 40,635 million to 59,861 million, while the average eviscerated weight per bird increased from 1.44kg to 1.55kg.
The number of birds killed in Asia went up from 14,687 million to 24,723 million during this period. Average carcass weights in this region appear not to have increased from around 1.3kg, which contrasts markedly with the situation in the Americas, where average eviscerated weights climbed from 1.67kg to 1.93kg per bird.
The regional breakdown of global indigenous chicken meat production (Table 1) indicates that, in 2012 – the most recent year for final FAO data – the Americas accounted for 43 per cent of the total of almost 93 million tonnes, while Asia provided 34 per cent, Europe almost 17 per cent, Africa five per cent and Oceania a little over one per cent.
Back in 2000, the corresponding percentages were approximately 46, 32, 16, five and one per cent, respectively. So Asia’s share of the global total has increased at the expense of the Americas. Indigenous production is defined as the output from home-grown birds, plus the meat equivalent of such birds exported live.
| Table 1. Global chicken meat production | |||||||||||
| Region | 2000 | 2005 | 2006 | 2007 | 2008 | 2009 | 2010 | 2011 | 2012 | 2013E | 2014F |
|---|---|---|---|---|---|---|---|---|---|---|---|
| Indigenous chicken meat* production (million tonnes) | |||||||||||
| Africa | 2.8 | 3.3 | 3.4 | 3.7 | 4.0 | 4.2 | 4.5 | 4.6 | 4.6 | 4.7 | 4.7 |
| Americas | 27.1 | 32.7 | 33.7 | 35.0 | 37.5 | 36.9 | 38.6 | 39.8 | 40.1 | 40.6 | 41.3 |
| Asia | 18.6 | 22.4 | 23.5 | 25.0 | 26.2 | 28.0 | 29.2 | 29.9 | 31.4 | 31.8 | 32.1 |
| Europe | 9.3 | 10.9 | 10.8 | 11.6 | 12.1 | 13.3 | 13.9 | 14.6 | 15.4 | 15.9 | 16.5 |
| Oceania | 0.7 | 0.9 | 1.0 | 1.0 | 1.0 | 1.0 | 1.1 | 1.2 | 1.2 | 1.2 | 1.2 |
| WORLD | 58.5 | 70.3 | 72.3 | 76.2 | 80.7 | 83.4 | 87.3 | 90.1 | 92.7 | 94.2 | 95.8 |
| Broiler meat production (million tonnes) | |||||||||||
| WORLD | 50.1 | 63.1 | 64.3 | 68.3 | 72.8 | 73.6 | 78.2 | 81.2 | 83.2 | 84.1 | 85.3 |
| *Meat from the slaughter of birds originating in a country, plus the meat equivalent of any such birds exported live. E 2013 and F 2014 = 5m estimates and forecasts for chicken meat; F 2014 = USDA forecasts for broiler meat. Regional figures may not add up to the world totals due to rounding. Sources: FAO for chicken meat, USDA for broiler meat |
|||||||||||
Our estimates for 2013 and 2014 suggest increases in poultry meat of 1.6 per cent and 1.7 per cent, respectively, while the indications are that in 2015 output will expand by more than two per cent as it approaches 98 million tonnes.
In the lower part of Table 1, the United States Department of Agriculture’s (USDA) estimates for world broiler production are presented. These figures broadly approximate to around 90 per cent of the FAO’s chicken output data, which include culled layers and breeders with all forms of table chickens. The USDA series indicates that output in 2013 and 2014 is likely to have expanded by 1.1 per cent and 1.4 per cent, respectively, compared with the 4.3 per cent achieved between 2000 and 2012.
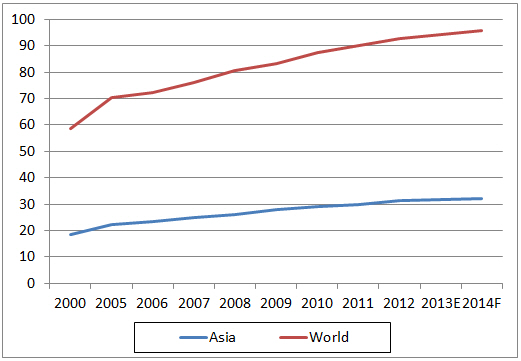
Between 2000 and 2012, chicken production in Asia expanded at almost 4.5 per cent per year which was faster than the global average of 3.9 per cent (Table 1 and Figure 2) which is why this region managed to increase its share of global output by two percentage points from 31.8 to 33.9 per cent. However, the increase in this regional total was dramatically depressed in 2013 and 2014 as growth slowed to around one per cent a year.
Chicken meat production throughout Asia is presented in Table 2, followed by the individual country ranking in Table 3.
| Table 2. Indigenous chicken meat production in Asia ('000 tonnes eviscerated weight) | |||||||
| Country | 2000 | 2005 | 2008 | 2009 | 2010 | 2011 | 2012 |
|---|---|---|---|---|---|---|---|
| Afghanistan | 13.2 | 30.4 | 20.7 | 20.0 | 24.9 | 21.8 | 9.2 |
| Armenia | 0.4 | 3.9 | 3.9 | 2.9 | 4.9 | 4.3 | 5.9 |
| Azerbaijan | 16.2 | 31.8 | 49.3 | 65.6 | 62.8 | 69.1 | 86.8 |
| Bahrain | 0.6 | 0.6 | 0.8 | 0.8 | 0.8 | 0.8 | 0.8 |
| Bangladesh | 92.9 | 129.9 | 149.4 | 156.0 | 160.1 | 162.4 | 163.6 |
| Bhutan | 0.2 | 0.3 | 0.3 | 0.3 | 0.3 | 0.3 | 0.3 |
| Brunei Darussalam | 10.5 | 9.1 | 13.0 | 13.1 | 14.1 | 18.5 | 18.9 |
| Cambodia | 19.5 | 17.2 | 19.0 | 22.9 | 19.5 | 18.9 | 18.9 |
| China, Hong Kong | - | - | - | - | - | - | - |
| China, Macao | 1.2 | 1.3 | 1.0 | 1.3 | 1.3 | 1.1 | 1.1 |
| China, mainland | 8,426.9 | 9,399.3 | 10,748.6 | 11,145.7 | 11,566.8 | 11,556.1 | 12,667.2 |
| China, Taiwan | 630.6 | 554.7 | 521.6 | 541.5 | 557.7 | 588.9 | 543.7 |
| Cyprus | 31.6 | 32.8 | 28.0 | 27.0 | 26.9 | 26.5 | 24.7 |
| Georgia | 13.9 | 16.2 | 10.8 | 11.2 | 10.2 | 10.7 | 10.4 |
| India | 865.4 | 1,403.1 | 1,883.8 | 2,086.8 | 2,193.1 | 2,206.2 | 2,219.0 |
| Indonesia | 806.6 | 1,125.1 | 1,349.5 | 1,404.4 | 1,539.5 | 1,664.8 | 1,751.7 |
| Iran Isl. Rep. | 804.0 | 1,245.9 | 1,578.5 | 1,997.5 | 1,875.4 | 1,913.5 | 1,956.3 |
| Iraq | 73.7 | 84.1 | 48.3 | 33.1 | 48.2 | 81.6 | 84.8 |
| Israel | 270.1 | 369.8 | 439.5 | 435.6 | 449.4 | 479.4 | 479.4 |
| Japan | 1,193.0 | 1,271.1 | 1,368.0 | 1,412.4 | 1,415.6 | 1,376.5 | 1,443.2 |
| Jordan | 118.1 | 132.2 | 141.4 | 154.8 | 188.5 | 192.0 | 191.8 |
| Kazakhstan | 32.9 | 43.7 | 60.9 | 73.1 | 98.5 | 96.7 | 96.2 |
| Korea Dem. Peo. Rep. | 26.8 | 35.8 | 31.9 | 31.9 | 31.9 | 31.9 | 33.0 |
| Korea Rep. | 373.3 | 483.6 | 508.5 | 550.4 | 587.6 | 616.2 | 624.1 |
| Kuwait | 31.1 | 31.4 | 35.2 | 40.9 | 40.3 | 38.6 | 39.6 |
| Kyrgyzstan | 4.6 | 5.4 | 5.8 | 4.0 | 4.0 | 6.0 | 6.0 |
| Lao Peo. Dem. Rep. | 9.6 | 15.4 | 16.5 | 17.4 | 19.3 | 19.9 | 20.3 |
| Lebanon | 104.2 | 121.3 | 134.6 | 128.6 | 127.6 | 129.3 | 130.3 |
| Malaysia | 713.9 | 916.1 | 1,001.7 | 1,083.0 | 1,213.9 | 1,249.8 | 1,279.2 |
| Mongolia | 0.1 | 0.2 | 0.2 | 0.2 | 0.2 | 0.1 | 0.1 |
| Myanmar | 212.4 | 560.4 | 797.3 | 922.9 | 1,015.6 | 1,078.7 | 1,079.7 |
| Nepal | 12.6 | 15.3 | 16.5 | 16.5 | 16.5 | 36.1 | 40.3 |
| Occ. Palestinian Terr. | 68.3 | 65.0 | 47.0 | 47.3 | 52.0 | 52.0 | 52.0 |
| Oman | 4.2 | 5.8 | 5.3 | 5.4 | 5.6 | 5.6 | 5.7 |
| Pakistan | 327.3 | 385.4 | 599.1 | 650.3 | 706.0 | 768.0 | 776.0 |
| Philippines | 531.8 | 648.6 | 812.0 | 826.0 | 868.2 | 905.6 | 947.3 |
| Qatar | 4.2 | 5.3 | 6.9 | 7.3 | 7.3 | 9.2 | 9.8 |
| Saudi Arabia | 482.1 | 536.5 | 562.4 | 566.6 | 576.8 | 576.3 | 572.3 |
| Singapore | - | - | - | - | - | - | - |
| Sri Lanka | 62.7 | 96.7 | 102.2 | 99.0 | 102.0 | 102.1 | 104.1 |
| Syrian Arab Rep. | 106.0 | 160.4 | 178.3 | 182.2 | 188.9 | 177.2 | 136.4 |
| Tajikstan | 0.1 | 0.1 | 0.9 | 4.2 | 0.1 | 1.7 | 0.5 |
| Thailand | 1,051.0 | 1,006.6 | 1,156.1 | 1,152.0 | 1,218.9 | 1,256.0 | 1,263.4 |
| Timor-Leste | 1.0 | 0.7 | 0.8 | 0.8 | 0.7 | 0.7 | 0.8 |
| Turkey | 634.9 | 943.2 | 1,086.0 | 1,317.9 | 1,449.2 | 1,613.4 | 1,723.9 |
| Turkmenistan | 6.0 | 14.0 | 19.0 | 19.5 | 19.5 | 20.0 | 21.0 |
| United Arab Emirates | 25.0 | 34.3 | 33.4 | 37.8 | 39.6 | 40.6 | 41.1 |
| Uzbekistan | 15.7 | 20.9 | 23.4 | 24.1 | 25.9 | 30.0 | 30.8 |
| Viet Nam | 294.5 | 320.9 | 445.8 | 526.9 | 454.8 | 492.1 | 523.7 |
| Yemen | 65.2 | 112.3 | 134.7 | 137.7 | 143.7 | 149.1 | 151.4 |
| ASIA | 18,590.0 | 22,443.9 | 26,197.6 | 28,006.5 | 29,174.6 | 29,895.8 | 31,386.1 |
| - less than 50 tonnes Source: FAO |
|||||||
| Table 3. Indigenous chicken meat production ranking in Asia in 2012 ('000 tonnes) |
|
| Country | Production ('000 tonnes) |
|---|---|
| China, mainland | 12,667.2 |
| India | 2,219.0 |
| Iran Isl. Rep. | 1,956.3 |
| Indonesia | 1,751.7 |
| Turkey | 1,723.9 |
| Japan | 1,443.2 |
| Malaysia | 1,279.2 |
| Thailand | 1,263.4 |
| Myanmar | 1,079.7 |
| Philippines | 947.3 |
| Pakistan | 776.0 |
| Korea Rep. | 624.1 |
| Saudi Arabia | 572.3 |
| China, Taiwan | 543.7 |
| Viet Nam | 523.7 |
| Israel | 479.4 |
| Jordan | 191.8 |
| Bangladesh | 163.6 |
| Yemen | 151.4 |
| Syrian Arab Rep. | 136.4 |
| Lebanon | 130.3 |
| Sri Lanka | 104.1 |
| Kazakhstan | 96.2 |
| Azerbaijan | 86.8 |
| Iraq | 84.8 |
| Occ. Palestinian Terr. | 52.0 |
| United Arab Emirates | 41.1 |
| Nepal | 40.3 |
| Kuwait | 39.6 |
| Korea Dem. Peo. Rep. | 33.0 |
| Uzbekistan | 30.8 |
| Cyprus | 24.7 |
| Turkmenistan | 21.0 |
| Lao Peo. Dem. Rep. | 20.3 |
| Cambodia | 18.9 |
| Brunei Darussalam | 18.9 |
| Georgia | 10.4 |
| Qatar | 9.8 |
| Afghanistan | 9.2 |
| Kyrgyzstan | 6.0 |
| Armenia | 5.9 |
| Oman | 5.7 |
| China, Macao | 1.1 |
| Timor-Leste | 0.8 |
| Bahrain | 0.8 |
| Tajikstan | 0.5 |
| Bhutan | 0.3 |
| Mongolia | 0.1 |
| Singapore | - |
| China, Hong Kong | - |
| - less than 50 tonnes Source: FAO |
|
According to USDA, broiler output estimates (Table 4), this was the result of a slump in production in China of around one million tonnes over the two years following the impact of avian influenza outbreaks on production and consumer demand.
| Table 4. Leading broiler meat producers in Asia ('000 tonnes) | |||||||||||
| Country | 2000 | 2005 | 2006 | 2007 | 2008 | 2009 | 2010 | 2011 | 2012 | 2013 | 2014F |
|---|---|---|---|---|---|---|---|---|---|---|---|
| China | 9,269 | 10,200 | 10,350 | 11,291 | 11,840 | 12,100 | 12,550 | 13,200 | 13,700 | 13,350 | 12,700 |
| India | 1,080 | 1,900 | 2,000 | 2,240 | 2,490 | 2,550 | 2,650 | 2,900 | 3,160 | 3,450 | 3,725 |
| Turkey | 662 | 978 | 946 | 1,012 | 1,170 | 1,250 | 1,420 | 1,619 | 1,707 | 1,760 | 1,810 |
| Thailand | 1,070 | 950 | 1,100 | 1,050 | 1,170 | 1,200 | 1,280 | 1,350 | 1,550 | 1,500 | 1,600 |
| Indonesia | 804 | 1,126 | 1,260 | 1,295 | 1,350 | 1,409 | 1,465 | 1,515 | 1,540 | 1,550 | 1,565 |
| Japan | 1,091 | 1,166 | 1,258 | 1,250 | 1,255 | 1,283 | 1,295 | 1,251 | 1,325 | 1,329 | 1,335 |
| Malaysia | 650 | 860 | 922 | 931 | 930 | 1,014 | 1,140 | 1,174 | 1,210 | 1,245 | 1,265 |
| Iran | 586 | 673 | 691 | 710 | 722 | 745 | 765 | 785 | 805 | 820 | 840 |
| F = forecast Chicken paws are excluded Source: USDA |
|||||||||||
Clearly the region is dominated by mainland China which, in 2012, accounted for almost 12.7 million tonnes or more than 40 per cent of the regional total of 31.4 million tonnes. Table 3 reveals that another eight countries, each producing more than one million tonnes a year, had a combined output of some 12.7 million tonnes representing a further 40.5 per cent of the total.
The USDA series on broiler production, which includes estimates for both 2013 and 2014 (Table 4 and Figure 3), broadly speaking shows a similar picture to that given by the FAO chicken meat data. There is, however, one highly significant difference in that the USDA’s figures for Iran in 2012 at 805,000 tonnes are only around 41 per cent of the FAO’s chicken meat data of almost two million tonnes, which relate to annual slaughterings of some 1,630 million birds with an average eviscerated weight of 1.2kg.
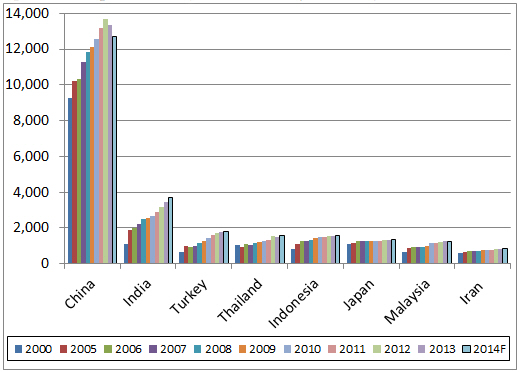
While Figure 3 shows the leading broiler-producing countries according to the USDA and how their industries have developed since 2000, the longer term picture for some of the key players from 1990 (Figures 4 to 7) reveal markedly differing trends.
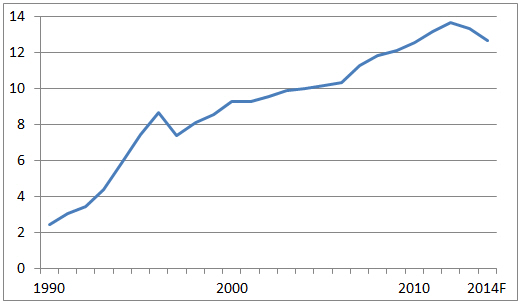
China’s broiler output boomed by more than eight per cent per year between 1990 and 2012. However, an outbreak of avian influenza in March 2013 had a dramatic impact on supply, which nose-dived from the 2012 peak of 13.7 million tonnes to 13.4 million tonnes in the following year and further to an estimated 12.7 million tonnes for 2014 (Figure 4).
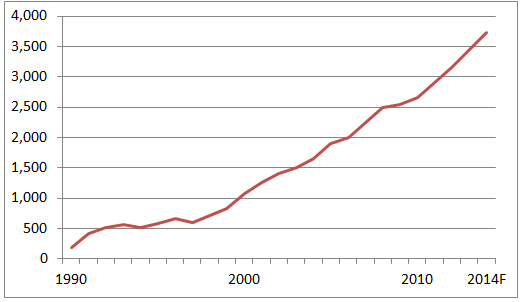
India, the second largest producer in Asia and fourth in the world, has one of, if not the, fastest expanding broiler industry in the world with growth averaging 13 per cent a year since 1990 (Figure 5).
The industry passed through a difficult period in 2012 with growth slipping to nine per cent when record high feed costs coincided with an oversupplied market as the industry had reacted to good profits in 2010 and 2011. The efforts of some of the larger integrators to produce a more balanced supply/demand situation resulted in a significant improvement in profits in 2013.
According to the Investment and Credit Rating Agency of India (INCRA Ltd) the demand for broiler meat will continue to grow at eight to 10 per cent per year.
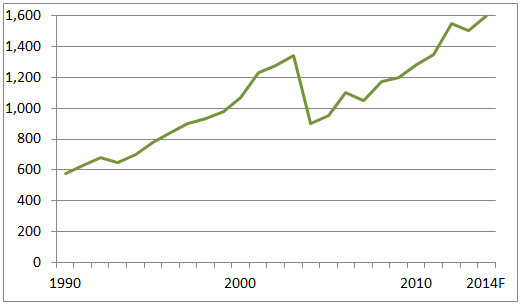
The broiler industry in Thailand suffered a major blow in 2004 when its exports of frozen uncooked chicken were banned by several countries following an outbreak of highly pathogenic avian influenza (HPAI).
Consequently, production slumped by a massive 33 per cent to 900,000 tonnes in that year (Figure 6). Since then, the industry has recovered with the estimate for this year standing at a record 1.6 million tonnes.
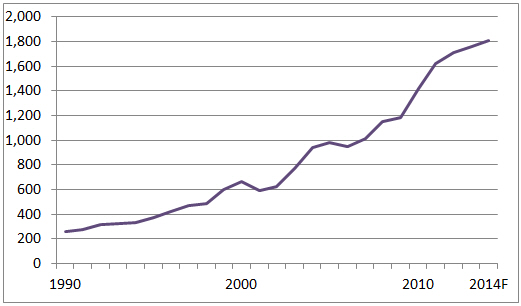
Broiler production in Turkey expanded rapidly by almost nine per cent per year from 1990 to 2011 (Figure 7).
While the increases have been more moderate since then, output is still forecast to reach a record 1.8 million tonnes in 2014. Domestic consumption has declined since 2012 due to media campaigns accusing the industry of giving the birds genetically modified feed, hence increases in production have mainly come off the back of growing exports.
September 2014


