GLOBAL POULTRY TRENDS - Chicken Meat Output to Exceed 100 Million Tonnes
The Americas is the largest chicken meat producing region in the world, but the industry there has grown more slowly than in other regions in recent years, writes industry analyst Terry Evans. By:
By: World chicken meat production could well top 100 million tonnes in 2016, of which the Americas will likely contribute around 44.3 million tonnes or 44 per cent (Table 1 and figure 1).
The estimated global total for this year of some 99 million tonnes compares with an actual figure of 96.3 million tonnes in 2013. While the Americas is clearly the largest producing region, the 2015 estimate when compared with ten years ago reveals that its share of the global total has actually declined from 46.5 per cent to around 43.8 per cent.
This is because the rate of growth in this region will have averaged less than 3 per cent over the decade compared with 4 per cent or more in the other major producing regions and a world average of 3.5 per cent.
Forecast above-world average growth in both Brazil and the USA next year could raise this region’s share to around 44 per cent. The Food and Agriculture (FAO) data presented in Table 1 includes estimates of the output from culled layers and backyard flocks with those for table chickens.
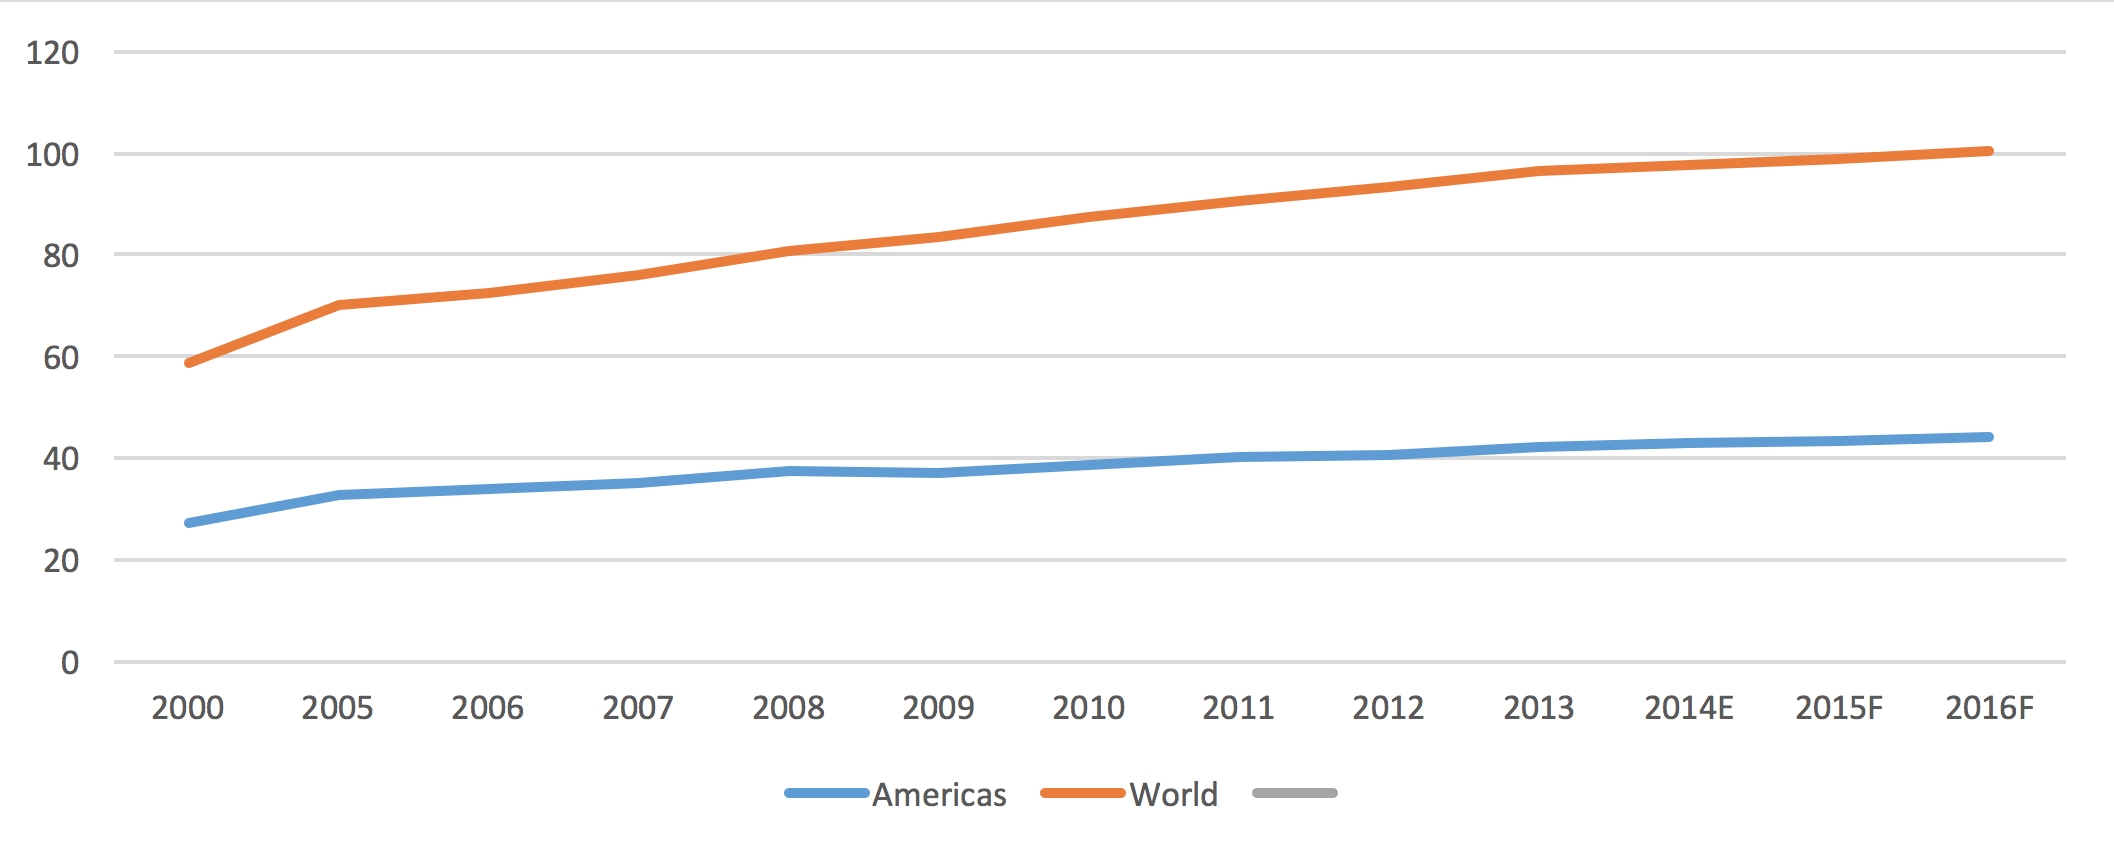 Figure 1. World chicken meat output has grown faster than in the Americas (million tonnes)
Data provided by the USDA relating specifically to broiler meat production point to a 3.4 per cent per year expansion in global production with output climbing from 63.1 million tonnes in 2005 to an estimated 87.9 million tonnes this year, while in 2016 it is expected to exceed 89 million tonnes (Table 1).
Despite concerns over outbreaks of avian influenza, the outlook for most poultry industries is good with favourable feed prices and less competition from competitive meats.
The major producers in Latin America are currently looking at ways of combating and preventing outbreaks of this disease, including the setting up of funds and contingency plans, to include the establishment of biosecurity controls.
| Table 1. Indigenous* chicken meat production (million tonnes) | |||||||||||||
| Region | 2000 | 2005 | 2006 | 2007 | 2008 | 2009 | 2010 | 2011 | 2012 | 2013 | 2014E | 2015F | 2016F |
| Africa | 2.8 | 3.3 | 3.4 | 3.7 | 4.0 | 4.2 | 4.5 | 4.5 | 4.6 | 4.7 | 4.9 | 4.9 | 4.9 |
| Americas | 27.1 | 32.7 | 33.7 | 35.0 | 37.5 | 36.9 | 38.8 | 40.0 | 40.5 | 42.1 | 42.8 | 43.4 | 44.3 |
| Asia | 18.6 | 22.4 | 23.5 | 25.0 | 26.2 | 28.0 | 29.2 | 30.3 | 31.6 | 32.2 | 32.1 | 32.7 | 33.1 |
| Europe | 9.5 | 10.9 | 10.8 | 11.6 | 12.1 | 13.3 | 13.9 | 14.6 | 15.5 | 16.1 | 16.5 | 16.7 | 17.0 |
| Oceania | 0.7 | 0.9 | 1.0 | 1.0 | 1.0 | 1.0 | 1.1 | 1.2 | 1.2 | 1.3 | 1.2 | 1.3 | 1.3 |
| WORLD | 58.7 | 70.3 | 72.3 | 76.2 | 80.7 | 83.4 | 87.4 | 90.6 | 93.3 | 96.3 | 97.5 | 99.0 | 100.6 |
| Broiler meat production (million tonnes) | |||||||||||||
| WORLD | 50.1 | 63.1 | 64.3 | 68.3 | 72.8 | 73.6 | 78.2 | 81.2 | 83.3 | 84.5 | 86.6 | 87.9 | 89.3 |
| *Meat from the slaughter of birds originating in a country, plus the meat equivalent of any such birds exported live. | |||||||||||||
| E 2014, F 2015 and F2016 author's estimates and forecasts for chicken meat, F 2015 and 2016 USDA forecast for broiler meat. | |||||||||||||
| Regional figures may not add up to the world totals due to rounding. | |||||||||||||
| Sources: FAO for chicken meat, USDA for broiler meat. | |||||||||||||
At least one long-term forecast for poultry meat foresees continued growth at around 2 per cent per year, with output coming close to 134 million tonnes by 2024. In broad terms chicken meat accounts for almost 89 per cent of all poultry meat so, by 2024, chicken production could be in the region of 119 million tonnes.
Chicken meat production in all the countries in the Americas (Table 2) reveals that between 2000 and 2013 output expanded by 3.5 per cent per year from 27.1 to 42.1 million tonnes.
The USA was the leading producer with 17.6 million tonnes in 2013, though the rate of growth here was less than 2 per cent per year. In contrast Brazil’s industry expanded by nearly 6 per cent per year to reach 12.4 million tonnes over the same period.
In 2013, seven countries in the region produced more than a million tonnes a year (Table 3) giving a combined total of 38.3 million tonnes or almost 91 per cent of the regional total.
| Table 2. Chicken meat production in the Americas ('000 tonnes eviscerated weight) | |||||||
| Country | 2000 | 2005 | 2009 | 2010 | 2011 | 2012 | 2013 |
| Antigua/Barbuda | 0.3 | 0.3 | 0.2 | 0.1 | 0.1 | 0.1 | * |
| Argentina | 957.0 | 1008.9 | 1500.2 | 1597.4 | 1648.2 | 1664.2 | 1779.1 |
| Bahamas | 4.5 | 5.8 | 6.1 | 6.2 | 6.3 | 6.4 | 6.6 |
| Barbados | 11.4 | 16.0 | 15.1 | 14.7 | 15.0 | 15.4 | 15.4 |
| Belize | 8.5 | 13.7 | 12.8 | 13.5 | 13.5 | 14.2 | 15.8 |
| Bermuda | 0.1 | 0.1 | 0.1 | 0.1 | 0.1 | 0.1 | 0.1 |
| Bolivia | 133.9 | 183.0 | 318.9 | 380.8 | 373.3 | 373.3 | 376.5 |
| Brazil | 5990.6 | 7890.1 | 9968.9 | 10733.0 | 11476.3 | 11588.1 | 12435.5 |
| Canada | 900.0 | 998.0 | 964.8 | 971.6 | 969.6 | 979.7 | 992.3 |
| Chile | 380.4 | 457.4 | 513.8 | 503.7 | 555.1 | 565.4 | 576.6 |
| Colombia | 506.6 | 764.0 | 1026.8 | 1067.4 | 1075.7 | 1113.7 | 1276.8 |
| Costa Rica | 72.8 | 98.7 | 112.8 | 112.2 | 107.0 | 113.3 | 108.4 |
| Cuba | 73.4 | 29.5 | 33.2 | 33.6 | 35.4 | 37.5 | 34.7 |
| Dominica | 0.3 | 0.3 | 0.3 | 0.3 | 0.3 | 0.3 | 0.3 |
| Dominican Rep | 209.6 | 296.3 | 320.7 | 330.5 | 270.3 | 249.3 | 269.5 |
| Ecuador | 191.0 | 205.3 | 304.6 | 334.1 | 325.0 | 325.0 | 335.0 |
| El Salvador | 85.5 | 110.3 | 109.4 | 118.9 | 125.8 | 126.9 | 131.8 |
| Falkland Isl (Malvinas) | * | * | * | * | * | * | * |
| French Guiana | 0.4 | 0.4 | 0.5 | 0.5 | 0.5 | 0.5 | 0.5 |
| Grenada | 0.3 | 0.4 | 0.5 | 0.5 | 0.4 | 0.4 | 0.4 |
| Guadaloupe | 1.3 | 1.4 | 1.4 | 1.4 | 1.4 | 1.4 | 1.4 |
| Guatemala | 133.4 | 137.2 | 170.9 | 161.4 | 162.0 | 170.0 | 171.8 |
| Guyana | 11.8 | 22.7 | 27.1 | 24.8 | 25.5 | 30.3 | 29.2 |
| Haiti | 7.9 | 7.7 | 7.9 | 8.1 | 8.2 | 7.7 | 7.7 |
| Honduras | 74.0 | 139.0 | 143.6 | 130.7 | 144.6 | 153.2 | 153.5 |
| Jamaica | 76.8 | 99.8 | 104.2 | 102.2 | 100.7 | 102.2 | 103.8 |
| Martinique | 1.1 | 0.7 | 1.1 | 1.2 | 1.3 | 1.3 | 1.4 |
| Mexico | 1819.4 | 2432.0 | 2632.4 | 2675.8 | 2758.0 | 2785.6 | 2801.3 |
| Montserrat | 0.1 | 0.1 | 0.1 | 0.1 | 0.1 | 0.1 | 0.1 |
| Netherlands Ant | 0.3 | 0.2 | 0.3 | 0.3 | 0.3 | 0.3 | 0.3 |
| Nicaragua | 45.7 | 70.2 | 87.3 | 90.1 | 88.0 | 75.7 | 111.0 |
| Panama | 80.2 | 92.5 | 116.2 | 123.5 | 133.5 | 141.6 | 143.8 |
| Paraguay | 30.1 | 40.7 | 23.3 | 20.8 | 20.5 | 25.2 | 25.0 |
| Peru | 540.8 | 656.5 | 965.6 | 1021.0 | 1085.4 | 1172.2 | 1203.2 |
| Puerto Rico | 59.6 | 49.6 | 52.2 | 55.0 | 58.0 | 58.0 | 58.0 |
| Saint Kitts/Nevis | 0.1 | 0.1 | 0.2 | 0.2 | 0.1 | 0.1 | 0.1 |
| Saint Lucia | 0.4 | 0.7 | 1.4 | 1.4 | 1.5 | 1.5 | 1.5 |
| Saint Vincent/Gren | 0.3 | 0.2 | 0.5 | 0.5 | 0.5 | 0.5 | 0.5 |
| Suriname | 4.0 | 6.4 | 9.2 | 11.2 | 10.0 | 10.8 | 7.9 |
| Trinidad/Tobago | 38.7 | 56.7 | 57.9 | 64.8 | 63.6 | 65.2 | 66.3 |
| USA | 13947.0 | 16046.3 | 16338.1 | 16974.0 | 17114.0 | 17183.0 | 17546.1 |
| US Virgin Isl | 0.1 | 0.1 | 0.1 | 0.1 | 0.1 | 0.1 | 0.1 |
| Uruguay | 56.5 | 51.8 | 72.6 | 68.9 | 85.1 | 84.1 | 43.7 |
| Venezuela Bol Rep | 664.6 | 736.4 | 891.1 | 1077.5 | 1164.1 | 1212.2 | 1273.0 |
| AMERICAS | 27120.6 | 32727.4 | 36913.9 | 38834.0 | 40024.1 | 40451.0 | 42105.5 |
| * less than 50 tonnes | |||||||
| Source: FAO | |||||||
| Table 3. Chicken meat production ranking in the Americas in 2013 | |||||||
| USA | 17546.1 | ||||||
| Brazil | 12435.5 | ||||||
| Mexico | 2801.3 | ||||||
| Argentina | 1779.1 | ||||||
| Colombia | 1276.8 | ||||||
| Venezuela Bol Rep | 1273.0 | ||||||
| Peru | 1203.2 | ||||||
| Canada | 992.3 | ||||||
| Chile | 576.6 | ||||||
| Bolivia | 376.5 | ||||||
| Ecuador | 335.0 | ||||||
| Dominican Rep | 269.5 | ||||||
| Guatemala | 171.8 | ||||||
| Honduras | 153.5 | ||||||
| Panama | 143.8 | ||||||
| El Salvador | 131.8 | ||||||
| Nicaragua | 111.0 | ||||||
| Costa Rica | 108.4 | ||||||
| Jamaica | 103.8 | ||||||
| Trinidad/Tobago | 66.3 | ||||||
| Puerto Rico | 58.0 | ||||||
| Uruguay | 43.7 | ||||||
| Cuba | 34.7 | ||||||
| Guyana | 29.2 | ||||||
| Paraguay | 25.0 | ||||||
| Belize | 15.8 | ||||||
| Barbados | 15.4 | ||||||
| Suriname | 7.9 | ||||||
| Haiti | 7.7 | ||||||
| Bahamas | 6.6 | ||||||
| Saint Lucia | 1.5 | ||||||
| Guadaloupe | 1.4 | ||||||
| Martinique | 1.4 | ||||||
| French Guiana | 0.5 | ||||||
| Saint Vincent/Gren | 0.5 | ||||||
| Grenada | 0.4 | ||||||
| Dominica | 0.3 | ||||||
| Netherlands Ant | 0.3 | ||||||
| Bermuda | 0.1 | ||||||
| Montserrat | 0.1 | ||||||
| Saint Kitts/Nevis | 0.1 | ||||||
| US Virgin Isl | 0.1 | ||||||
| Source: FAO | |||||||
More recent data provided by the USDA on broiler production shows that in 2016 output in the USA is expected to reach a record 18.4 million tonnes, while for Brazil, production could come close to 13.5 million tonnes as this country replaces China as the world’s second largest producer for the second successive year (Table 4).
In contrast, little change is anticipated in production levels in both Mexico and Argentina at around 3.2 and 2.1 million tonnes respectively. For other significant producers such as Peru, Columbia and Canada production estimates continue to hover around a million tonnes a year.
| Leading broiler meat producers in the Americas ('000 tonnes eviscerated weight) | |||||||||||||
| Country | 2000 | 2005 | 2006 | 2007 | 2008 | 2009 | 2010 | 2011 | 2012 | 2013 | 2014 | 2015F | 2016F |
| USA | 13703 | 15870 | 15930 | 16226 | 16561 | 15935 | 16563 | 16694 | 16621 | 16976 | 17299 | 17966 | 18365 |
| Brazil | 5980 | 9350 | 9355 | 10305 | 11033 | 11023 | 12312 | 12863 | 12645 | 12308 | 12692 | 13080 | 13480 |
| Mexico | 1936 | 2498 | 2592 | 2683 | 2853 | 2781 | 2822 | 2906 | 2958 | 2907 | 3025 | 3100 | 3160 |
| Argentina | 870 | 1030 | 1200 | 1320 | 1435 | 1500 | 1680 | 1770 | 2014 | 2060 | 2050 | 2060 | 2100 |
| F forecast | |||||||||||||
| Source: USDA | |||||||||||||
According to World Agricultural Supply and Demand Estimates (WASDE) broiler production in the USA this year will amount to a shade under 18 million tonnes. The prospect of lower feed prices has prompted a 2.2 per cent increase in the forecast for broiler output in 2016 pushing the total towards 18.5 million tonnes.
Average slaughter weights have increased such that over the first four months of 2015 the average live weight was 6.1lbs (2.8kg) or 1.8 per cent higher than in the same period in 2014 and close to the average gain for the whole of 2014.
Broiler production in Brazil is expected to expand by 2.5 per cent to reach a record 13.1 million tonnes in 2015, as a result of higher exports stimulated by depreciation of the Real. According to a USDA report, margins are expected to continue positive but at a declining rate as production costs increase.
The report also notes that there are uncertainties regarding Brazil’s economic outlook which could put a brake on expansion. In the five years 2009 to 2014 broiler production is calculated to have grown by 2.8 per cent per year, but at least one forecast suggests that it might grow by as much as 3 per cent in 2016 to 13.5 million tonnes.
Ricardo Santin, Vice-President of the Poultry Division of the Brazilian Association of Animal Protein (ABPA) considers that the greatest challenge facing the chicken industry in the next 10 to 20 years is balancing environmental and animal welfare concerns with an increasing demand.
Measures taken by Mexico to counter avian influenza outbreaks in 2012 and 2013 appear to have been sufficient to allow the poultry sector to rebound to record production levels according to a USDA Gain Report. So far as the broiler sector is concerned, its 2 per cent per year expansion rate is being maintained which could push output in 2016 close to a record 3.2 million tonnes.
Between 2009 and 2012 Argentina’s broiler industry grew at the rapid rate of more than 10 per cent per year to exceed 2 million tonnes. Provisional data for 2015 indicate a further 0.5 per cent gain at 2.06 million tonnes. Since then growth has been relatively slow with the most recent estimate for 2016 of 2.1 million tonnes.
Broiler production in Canada is expected to rise by 3 per cent this year and a further 2 per cent in 2016 when output will likely exceed 1.1 million tonnes.
 3 July 2026
 3
minute read
3
minute read