

Progress Report on Salmonella Testing of Raw Meat and Poultry Products, 1998-2003
By the USDA's Food Safety and Inspection Service - The FSIS has released regulatory sampling data showing a continued downward trend in positive tests for Salmonella. The Hazard Analysis and Critical Control Point (HACCP) rule, implemented July 25, 1996, established Salmonella performance standards in seven categories of meat and poultry products; broilers; market hogs; cows/bulls; steer/heifer; ground beef; ground chicken; and ground turkey.
The Food Safety and Inspection Service (FSIS) issued the Pathogen Reduction; Hazard Analysis and Critical Control Point (HACCP) Systems; Final Rule on July 25, 1996: Federal Register, Vol. 61, No. 144, pp. 38805-38989. To verify that industry Pathogen Reduction/HACCP (PR/HACCP) systems are effective in controlling the contamination of raw meat and poultry products with disease-causing bacteria, the PR/HACCP rule sets Salmonella performance standards (the maximum allowable prevalence of Salmonella) that slaughter establishments and establishments that produce raw ground products should meet.
These product-specific limits on Salmonella became effective in large establishments on January 26, 1998, in small establishments on January 25, 1999, and in very small establishments on January 25, 2000. FSIS verifies that establishments are meeting the standards by having federal inspection personnel collect randomly selected product samples and send them to FSIS laboratories for Salmonella analysis, according to procedures described in Appendix E of the PR/HACCP final rule: Federal Register, Vol. 61, No. 144, pp. 38917-38928
(http://www.fsis.usda.gov/OA/fr/haccp_rule.htm).
The Salmonella performance standards are based on the prevalence of Salmonella as determined from the agency’s nationwide microbiological baseline studies
(http://www.fsis.usda.gov/Science/Baseline_Data/) conducted before PR/HACCP was implemented. Raw products currently covered by performance standards are carcasses of cows/bulls, steers/heifers, market hogs, and broilers, and ground beef, ground chicken, and ground turkey.
The performance standards are expressed in terms of the maximum number of Salmonella-positive samples that are allowed per sample set. The number of samples in a sample set varies by product, and the maximum number of positive samples allowed in a set provides an 80% probability of an establishment passing when it is operating at the standard.
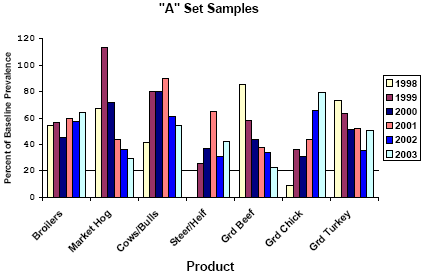
Figure 1: Comparison of Product Salmonella Prevalences in the PR/HACCP Verification Testing Program and Baseline Prevalences*  * Bars represent PR/HACCP Salmonella prevalences divided by baseline Salmonella prevalences. |
An initial sample set or a set that follows a passed set is designated an “A” set; other codes (such as “B”, “C”, and “D”) represent sample sets collected from establishments that are targeted for follow-up testing following a failed set. Code “A” sample sets are collected at randomly selected establishments.
The prevalence data reported here for Salmonella in raw meat and poultry products have certain limitations that restrict the range of valid statistical inferences. The PR/HACCP verification testing program is strictly regulatory in nature and was designed to track establishment performance rather than to estimate nationwide prevalence of Salmonella in products.
Therefore, different establishments may be sampled from year to year, confounding rigorous trend analyses. Furthermore, it is important to note that the prevalence estimates computed from FSIS’ pre-HACCP baseline studies and surveys were nationally representative because they were weighted on the basis of the production volume of the sampled establishments. In contrast, the PR/HACCP Salmonella prevalences from the regulatory testing program reported here represent unweighted test results from sampled establishments.
The data reported here are from code “A” sample sets. Presenting the “A” set data provides the most direct comparison to the baseline estimates that were used to establish the performance standards. Salmonella prevalence estimates are based on all “A” set samples collected during the indicated year, with no consideration given as to whether a sample is part of a complete or an incomplete set. The prevalence estimate is the number of positive samples divided by the total number of samples analyzed, expressed as a percentage. The percentages of sample sets meeting the Salmonella performance standards are based on “A” sets that were completed during the specified year, as defined by the collection date of the last sample in the sample set.
Last year, in the summary tables, a column was included for “size unknown” establishments. As PR/HACCP was implemented, establishments were asked to provide FSIS with “size” information (large, small, or very small). However, establishments have not been requested by the agency to update this information. In recent years, as additional establishments have applied for grants of inspection, there are some establishments with no size distinction. Again this year, to provide more complete information, FSIS has included these establishments in the “size unknown” (not reported to FSIS) category. In earlier reports, the very few “size unknown” establishments were included with the very small establishments.
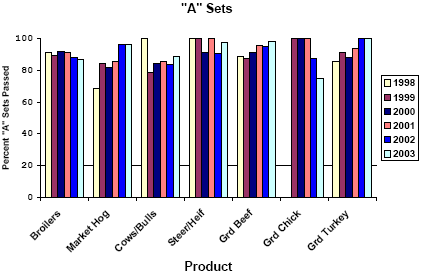
Figure 2: Overall Percentages of Sample Sets Meeting Salmonella Performance Standards *By Calendar Year, 1998 - 2003  * Includes sample sets from establishments of all sizes that completed during the indicated calendar year (sets may have started during an earlier year). |
During the last year (CY 2003), Salmonella prevalence in all product categories, for all sizes of establishments combined, was lower than in agency baseline studies and surveys conducted before PR/HACCP implementation (Table 1 and Figure 1). Differences in pre- versus post-HACCP Salmonella prevalence may reflect changes due to HACCP implementation. During CY 2003, both increases and decreases in prevalence from the previous year for specific product categories were observed. However overall, for all sizes of establishments combined, the CY 2003 Salmonella prevalence for market hogs, cows/bulls, and ground beef decreased, as compared to CY 2002, with only a slight (0.1%) increase for steers/heifers.
The Salmonella prevalence in broilers from all sizes of establishments combined increased slightly from 11.5% in CY 2002 to 12.8% in CY 2003. This overall increase for broilers was due to increases in Salmonella prevalence for large, small, and very small establishments in CY 2003, as compared to CY 2002. However, the CY 2003 overall level for broilers is still well below the baseline prevalence of 20.0%. Increases in Salmonella prevalence also were seen between CY 2002 and CY 2003 for large ground turkey and small ground chicken establishments.
Decreases in Salmonella prevalence were seen between CY 2002 and CY 2003 for specific product categories from specific sizes of establishments. For large establishments, the Salmonella prevalence in code “A” samples either decreased or remained the same in market hogs, cows/bulls, steers/heifers, ground beef, and ground chicken in CY 2003, as compared to CY 2002. The Salmonella prevalence decreased in small cow/bull, steer/heifer, ground beef, and ground turkey establishments, and in very small market hog, cow/bull, ground beef, and ground turkey establishments.
The results of six years of testing show that the majority of completed code “A” sample sets met the Salmonella performance standard (Table 2 and Figure 2). There were relatively small changes from CY 2002 to CY 2003 in the overall percentages (all sizes of establishments) of code “A” sample sets meeting the performance standards. Slight decreases were noted in the percentage of passed “A” sets from large and small broiler establishments, and from small market hog and ground chicken establishments in CY 2003, as compared to CY 2002. For all other product/establishment-size categories tested, the percentage of sets passing either increased or remained the same.
The Agency now has four years of data since regulatory testing covered all sizes of establishments beginning in 2000. The agency recognizes there have been some year-to-year variations in the number of samples taken in each of the product categories. To ensure that reductions noted in the overall yearly rate of Salmonella across the seven product categories was not attributable to sampling variations, the Agency weighted the four years of data (2000 – 2003) by the proportion of samples collected for each category in 2000. These weighted results continue to show a steady decrease in the percentage of product samples testing positive for Salmonella in each year of HACCP verification testing.
While the regulatory prevalence of Salmonella across all seven product categories continued to decrease in 2003, FSIS is concerned that the percentage of positive Salmonella tests (all sizes of establishments combined) increased slightly in all three poultry categories.
The Agency will be examining Salmonella set data from 1998 to the present in order to clearly identify those plants displaying negative performance trends. Enforcement Investigations Analysis Officers (EIAO) will then conduct in-depth HACCP and sanitation verification reviews at those facilities to help ensure that this one-year increase does not continue.
Achieving a reduction in pathogens reduces the risk of illness. However, all segments of the food-production chain and consumers should continue to properly handle, cook, and store all meat, poultry, and other food products in order to guard against foodborne disease.
Further information
To read the full report, including tables, please click here. (PDF)
Source: - Food Safety and Inspection Service - August 2004


