UK Poultry and Poultrymeat Statistics - August 2005
By Defra - This monthly publication combines information from the UK Hatcheries Survey and Poultry Slaughterhouse Survey results together with other Defra statistics, and trade data, pulling all ‘official’ poultry statistics in one publication. 12 September 2005
 5 minute read

Section 1: UK Hatcheries Data - Placings and Eggs Set
UK placings of commercial broiler chicks in July 2005 were 3% higher than for the same period in 2004 (Table 1.1). Eggs set were 4% higher than for the same period in 2004 (Table 1.5).
UK placings of female broiler parent chicks in July 2005 were 18% lower than for the same period in 2004 (Table 1.2)
UK placings of turkey poults in July 2005 were 11% lower than for the same period in 2004 (Table 1.3). Eggs set for commercial turkeys were 17% lower than for the same period in 2004 (Table 1.6).
UK placings of commercial layer chicks in July 2005 were 4% higher than for the same period in 2004 (Table 1.4). Eggs set for commercial birds were 3% lower than for the same period in 2004 (Table 1.7).
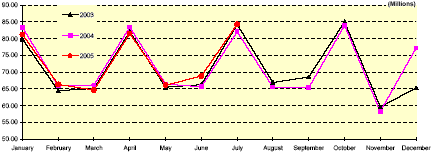
Chart 1.3: Monthly UK Turkey Poult Placings
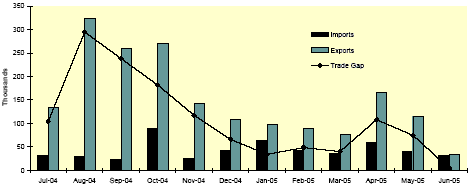
Section 2: UK Trade in Live Poultry
For the period January to June 2005, imports of commercial broiler chicks were 16% lower than for the same period in 2004, and exports were 54% lower (Table 2.1)
For the period January to June 2005, imports of turkey poults were 135% higher than for the same period in 2004, and exports were 29% lower (Table 2.2)
For the period January to June 2005, exports of live fowls were 203% higher than for the same period in 2004 (Table 2.3).
For the period January to June 2005, exports of live turkeys were 92% higher than for the same period in 2004 (Table 2.3).
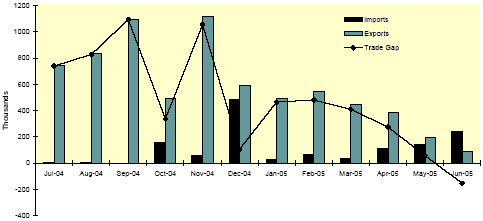
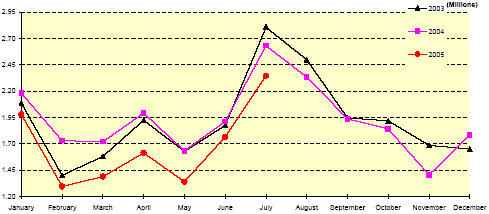
Chart 2.2: Imports and Exports of Turkey Poults
Section 3: UK Slaughterhouse Data - Numbers Slaughtered and Average Weights
UK slaughterings of broilers in July 2005 were 3% higher than for the same period in 2004 (Table 3.1). At 2.22kg the average liveweights in England & Wales were unchanged from the previous month (Table 3.4)
UK slaughterings of boiling fowls in July 2005 were 16% higher than for the same period in 2004 (Table 3.2). At 2.07 kg the average liveweights in England & Wales were 7% lower than in June 2005 (Table 3.4).
UK slaughterings of turkeys in July 2005 were 14% lower than for the same period in 2004 (Table 3.3). At 15.93kg the average liveweights of 'heavy' turkeys in England & Wales were 1% lower and at 5.58kg the average liveweights of 'light' turkeys were 1% higher than in June 2005 (Table 3.4).
Section 4: UK Poultrymeat Production, Trade and Domestic Usage (Net of Offal)
Total UK poultry production for Q2 2005 was 2% lower than in Q2 2004, with broiler production also 2% lower over the same period (Table 4.1).
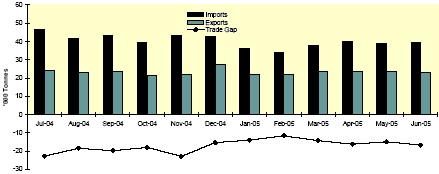
Total UK imports of poultrymeat in June 2005 were 1% higher than for the same period in 2004, with whole birds slightly higher and cuts 1% higher (Table 4.2).
Total UK exports of poultrymeat in June 2005 were 5% lower than for the same period in 2004, with whole birds 7% lower and cuts 5% lower (Table 4.3).
UK domestic usage of poultrymeat in Q2 2005 was 4% lower than in Q2 2004 (Table 4.4).
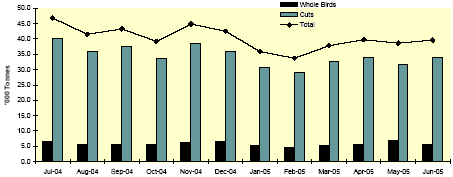
Chart 4.3: Exports of Whole Birds and Cuts
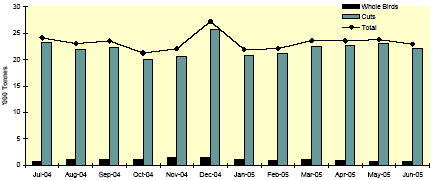
Chart 4.4: Total Poultrymeat Imports and Exports
Section 5: Other Poultry Statistics
UK Broiler Production of compound feed for poultry in June 2005 was 2% lower than the same period in 2004 (Table 5.1).
UK Layer Production of compound feed for poultry in June 2005 was 1% higher than for the same period in 2004 (Table 5.1).
UK Production of compound feed for poultry in June 2005 was 3% lower than for the same period in 2004 (Table 5.1).
The Chicken Frozen Price Index for July 2005 was 1% lower than for the same period in 2004 (Table 5.2).
The Chicken Fresh Price Index for July 2005 was 3% lower than the same period in 2004 (Table 5.2).
The Poultry Price Index for July 2005 was 5% lower than for the same period in 2004 (Table 5.2).
Link to main report
To read the full report, including tables (PDF - 14 pages, 735Kb) Click hereSource: Defra - August 2005