

US and World Agricultural Outlook 2010
Income and population growth are expected to raise per-capita meat consumption and fuel expansion in world trade, according to the Food and Agricultural Policy Research Institute (FAPRI) report 2010 US and World Agricultural Outlook.Executive Summary
According to the FAPRI report, the slow-down in the world economy in 2009 proved to be deeper and more widespread than originally anticipated, with an annual rate of real gross domestic product (GDP) growth of -1.9 per cent. However, recovery is projected to begin in 2010, with long-term real GDP growth of 3.3 per cent reached by 2011. With the recovery primarily driven by a fiscal stimulus and restocking of inventory, its sustainability centers on how quickly and robustly confidence is restored and the employment picture is improved, leading to transition into private consumption and investment demand for medium- to longer-term growth. Also, the economic recovery is accompanied by stronger energy prices of $94.2 per barrel in 2019, a cost pressure that might take some of the steam off the growth momentum.
The US dollar made significant gains in 2009 but resumes its real depreciation over the rest of the decade against the currencies of Australia, the EU, New Zealand, and Argentina. Many Asian currencies appreciate in real terms against the US dollar, with China experiencing especially large real appreciations.
In the world ethanol market, the 37 per cent drop in crude oil prices in 2009 as well as the 60 per cent reduction in US ethanol net imports contribute to an eight per cent decline in the world price of ethanol. The ethanol price is projected to remain relatively stable in 2010 before declining by nine per cent in 2011. The price of ethanol increases over the rest of the projection period as a result of increased demand brought about by US biofuel mandates. US ethanol imports are expected to come mainly from Brazil, which continues to increase the share of sugarcane production going into ethanol. World net trade increases over the decade, approaching 4.2 billion gallons. Mandates also drive demand for biodiesel in the EU and the Americas and raise net trade to 602 million gallons as well as pushing the world price to $5.58 per gallon.
In the outlook for sugar, because of the production shortfall in 2009/10, particularly in India, the world price of sugar increases by almost 60 per cent. The price declines by 26 per cent, to 19.0 cents/lb, in the following year as countries recover. However, it continues to remain high and reaches 20.4 cents/lb by the end of the projection period, as more sugarcane is used for ethanol in Brazil, and sugar imports of countries like China and the EU remain strong.
The world wheat price drops to $216 in 2009/10 because of larger crop production in key wheat importing countries, which lowers import demand. After downward pressure from high carry-over stocks in 2010/11, the price strengthens and reaches $222.7 per metric ton (mt) at the end of the decade. With strong competition from Russia and Ukraine, the US loses market share in the world wheat market. US net exports of wheat are projected to decline over the next decade.
The world corn price decreases to $162.9 per mt in 2009/10. It is projected to increase in 2010/11 to $168.3 per mt and reach $175.6 per mt in 2019/20. Argentina regains its market share while Brazil loses its market share. The world barley price declines in 2009/10 to $135 with lower import demand in world markets. It is projected to decline further, to $131.9, in 2010/11 and to reach $148 in 2019/20.
World prices of oilseeds remain relatively stable in 2009/10 as the supply rebound (especially for soybeans) is met with increased demand because of the economic recovery. Vegetable oils lead the oilseeds complex, as demand from both food and biodiesel uses expands firmly over the outlook period. While Asian countries, and in particular China and India, underpin much of the food demand growth, consumption mandates in the EU, Argentina, Brazil and the US strongly expand the usage for biodiesel production. Increased demand for protein meal from the growing and intensifying livestock sector in Asia supports the price of meal against the backdrop of large supplies owing to strong oil-driven crush and relatively stable demand for this commodity from developed countries.
Sanitary/phytosanitary and food safety concerns stemming from disease outbreaks and from traceability issues continued to affect the world meat market. While recovery from the economic recession in 2009 continues, income and population growth raise per-capita meat consumption and fuels expansion in world trade. Meat trade is projected to increase by 22.5 per cent, reaching 20.5 mmt in 2019. A recovery in demand, coupled with strong grain prices, keeps all meat prices relatively high over the next decade. Brazil and the US gain significant shares in the world meat market.
Dairy prices declined significantly in 2008/09 as a result of economic recession. They increase in 2010 because of economic recovery. In the long run, growth in population and incomes continues to put upward pressure on dairy prices. Australia, New Zealand and the EU remain the big exporters. While exports from the EU stagnate, Argentina and Brazil expand their dairy exports.
Outlook for US Agriculture
The global recession has had dramatic effects on the US farm sector. Net farm income declined by $30 billion in 2009, as commodity prices fell far below the peak levels of 2008. A modest forecast recovery of the general economy contributes to a modest projected recovery in the farm economy in 2010.
Livestock, poultry and dairy
Domestic and export demand for meat and dairy products was severely affected by lower incomes and higher unemployment rates in 2009. Meat consumption and exports declined and prices for livestock, poultry, and milk fell. The outlook for 2010 and beyond depends on the strength of the economic recovery. If incomes increase and consumer confidence returns, demand for meat and dairy products will strengthen. Meanwhile, livestock producers have scaled back production in response to the large losses many experienced in 2008 and 2009. The combination of stronger demand and limited supplies should result in at least some price recovery in 2010.
In spite of declining cattle numbers and beef production, cattle prices fell sharply in 2009 because of very weak demand. Reduced beef production and recovery in demand are expected to result in higher cattle prices for the next several years. Eventually, improved profitability encourages another modest expansion of beef production, and cattle prices level off.
Higher feed costs in 2008 and weak demand in 2009 contributed to two straight years of large economic losses to pork producers. The combination of reduced production and recovery in demand should result in higher hog prices in 2010 and 2011. As with beef, a return to profitability results in renewed growth in pork production in later years.
In the poultry sector, low returns resulted in a sharp decline in broiler production in 2009, the fi rst decline in decades. This steep reduction in supplies helped keep broiler prices from dropping as much as cattle and hog prices, and positioned the sector for resumed growth in 2010. One important concern for the broiler sector is the recent suspension of imports by Russia, a major US export market.
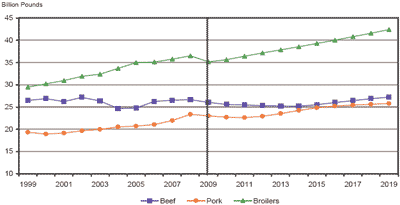
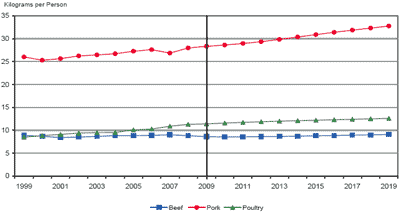
Also of concern to the poultry sector in particular and the meat sector in general are future levels of US meat consumption. After decades of growth, per capita meat consumption began to level off after 2004 and to decline after 2007. Projected meat consumption expands slowly after 2012 but remains well below the 2004 peak.
Milk prices fell sharply from record levels in the final months of 2008 and caused large losses for most dairy producers in 2009. As with the meat sector, the resulting reduction in supplies and the expectation of stronger domestic and foreign demand are expected to result in higher milk prices in 2010 and beyond.
Outlook for World Agriculture
A deeper and more widespread economic slowdown than originally anticipated depressed trade and prices in 2009. However, projected recovery in income growth, along with continuing world population growth and expanding bioenergy mandates, fuels recovery and sustains long-term strength in food, feed and fuel demand in the world.
Livestock and poultry
Driven by income growth, per capita meat consumption increases by 6.1kg in the next decade, representing a 1.3 per cent annual increase. Meat consumption reaches 54.5kg per person per year by 2019. Pork consumption has the highest share in the consumption basket, growing the fastest among the three meats at 1.6 per cent annually.
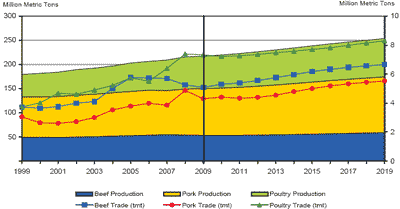
While sanitary and phytosanitary (SPS) issues and food safety concerns continue to impact the world meat market, recovery in meat demand increases world meat trade 22.5 per cent (3.76 million metric tons; mmt) in the next decade, with net trade reaching 20.47 mmt in 2019. Rising meat demand fuels a 16.8 per cent (36.43 mmt) increase in world meat production over the next decade, with production reaching 253.68 mmt in 2019.
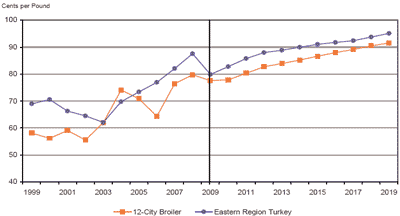
Recovery in the global economic situation pushes livestock and poultry prices relatively higher over the projection period. After an eight per cent drop in 2009, the beef price increases and peaks at $176.5/cwt in 2014. Despite the slight decline thereafter, it remains above $175/cwt in 2019. From a peak in 2004 of $52.5/cwt, the pork price cycles throughout the decade. The pork price peaks again in 2012 at $55.9/cwt and ends at $53.9/cwt in 2019. The poultry price strengthens over the next decade, growing 1.8 per cent annually and reaching a record high of $91.5/cwt in 2019.
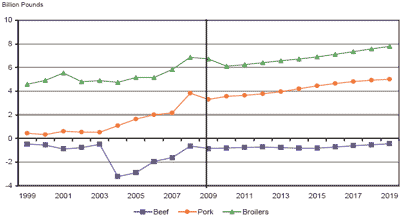
In the outlook for trade, world beef trade recovers and is projected to continue to grow at an average rate of 3.1 per cent annually throughout the decade, ending at 6.7 mmt in 2019. Responding to the recovery in trade and the growth of the world price, beef production increases at an annual rate of 1.1 per cent (0.56 mmt) in the next decade, reaching 58.9 mmt in 2019. In pork, after recovering from a 12 per cent drop in 2009, pork trade grows 2.8 per cent (122 tmt) annually in the next decade, reaching 5.52 mmt in 2019. Pork production increases in the next decade at an annual rate of 1.9 per cent (1.85 mmt), reaching 115.47 mmt in 2019. In poultry, a lower TRQ in Russia reduces broiler trade in the short run, but trade recovers and grows at a rate of 1.3 per cent annually over the projection period. Total broiler trade increases by 0.97 mmt, reaching 8.29 mmt in 2019. Total broiler production increases 1.8 per cent (1.2 mmt) annually, reaching 79.36 mmt in 2019.
US Poultry
For the first time in many decades, chicken production fell below the previous year's levels. Turkey production was also down. Feed prices are at historically high levels, and reduced demand for meat and egg products have hampered all segments of the poultry industry. Chicken production is expected to grow at around two per cent in the next decade. This is much lower than the 4.5 per cent average growth rate from 1990 to 2005.
Chicken markets provided a glimpse at value issues facing all meat products during a recession, as typically lower-valued wing prices eclipsed those of boneless skinless breasts in 2009. With its lower-priced protein, chicken is in the best position relative to beef and pork to survive tight consumer budgets. However, breast prices must increase for the industry to succeed in the long run. Prices will increase upon economic recovery but not as much as prices for beef and pork.
During the past decade, about 30 per cent of all chicken exports were destined for Russia. Russia is currently banning chicken treated with chlorine, the production process used in virtually all US plants. If the ban is not resolved quickly, a surplus of dark meat chicken will pull down other chicken part prices, as well as prices for beef and pork.
World Poultry
A lower TRQ in Russia reduces broiler trade in the short run, but trade recovers and grows at a rate of 1.3 per cent annually. Total broiler production increases by 0.97 mmt, reaching 8.29 mmt in 2019.
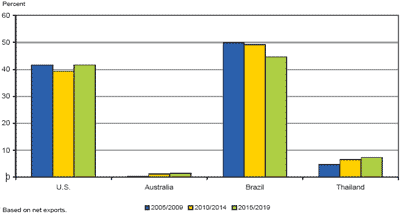
The US maintains its market share. The EU remains a net importer. Brazil loses 5.1 points of market share.
After losing 59.4 per cent of its exports because of avian influenza (AI), Thailand regains 2.6 points of market share in the next decade. Productivity improvements, product innovation, and a shift to higher-valued products enable Thailand to overcome SPS concerns and its higher cost of production. Australia gains 1.2 points of market share.
Over the rest of the decade, Brazil's net exports stay at around 3.6 mmt. Fiscal incentives and subsidies from local government continue to encourage large new investments in broiler production.
In 2009, Thailand's broiler sector began to recover from the AI crisis that caused a major export drop beginning in 2004. Recovery is helped by a new TRQ from the EU, expansion of integrated producers, productivity improvements (low feed conversion ratios), reduced processing costs, investment in production innovation and a shift to higher-valued cooked products. Thailand's net exports increase by 6.5 per cent annually, reaching 635 tmt in 2019.
The EU changed from a net exporter to a net importer in 2007 and it continues in this position. Its net poultry imports reach 29,000 mt in 2019.
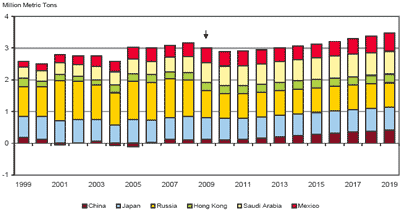
Under NAFTA, Mexico removed the global TRQ and its prohibitive out-quota rates. A safeguard agreement was reached with the US, whereby a TRQ for chicken leg quarters is imposed. The product is duty-free but out-quota is charged a 98.8 per cent duty. The TRQ was removed in 2008. Strong domestic demand drives net imports to grow 2.0 per cent annually and reach 577 tmt in 2019.
With its WTO accession, Taiwan removed its quota and replaced it with a 'tariff-only regime' in 2005. As a result, imports are projected to increase 7.3 per cent annually. They reach 116,000 mt in 2019. A shift to differentiated local breeds sustains domestic production at a growth rate of 1.5 per cent per year.
Russia imposes a lower TRQ of 0.78 mmt over the next decade. Over the outlook period, quota for imports is binding, as domestic production is encouraged and grows by 3.0 per cent, exceeding the 1.7 per cent growth in consumption. In the next decade, China's net imports grow rapidly, reaching 418,000 mt in 2019.
Further Reading
| - | You can view the full report by clicking here. |
April 2010


