

US August Egg Production Down One Percent
US - U.S. egg production totaled 7.31 billion during August 2003, down one percent from last year, report the National Agricultural Statistics Service (NASS).August Egg Production Down One Percent
U.S. egg production totaled 7.31 billion during August 2003, down one percent from last year.
Production included 6.24 billion table eggs and 1.07 billion hatching eggs, of which 1.01 billion
were broiler-type and 60.0 million were egg-type. The total number of layers during
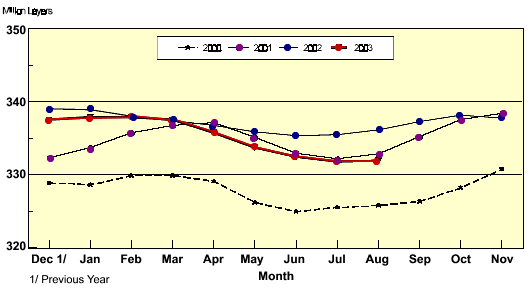
August 2003 averaged 332 million, down 1 percent from a year earlier. August egg production
per 100 layers was 2,201 eggs, up 1 percent from August 2002.
August 2003 contained 21 weekdays, and five Saturdays, compared to August 2002, with 22
weekdays and five Saturdays.
United States 2000 - 2003

All layers in the U.S. on September 1, 2003, totaled 332 million, down 1 percent from a year ago. The 332 million layers consisted of 275 million layers producing table or commercial type eggs, 54.9 million layers producing broiler-type hatching eggs, and 2.49 million layers producing egg-type hatching eggs. Rate of lay per day on September 1, 2003, averaged 70.6 eggs per 100 layers, down slightly from a year ago.
Laying flocks in the 30 major egg producing States produced 6.82 billion eggs during August 2003, down one percent from a year ago. The average number of layers during August, at 310 million, was down 2 percent from a year ago.
Individual State estimates are available for the 30 major egg producing States. These States are listed on page 8 of this release and account for approximately 94 percent of the total U.S. egg production. Production for the other States are grouped into an "Other States" category and combined with the 30 States published individually to obtain a U.S. estimate. Individual State estimates for "Other States" are available annually in the "Chickens and Eggs Summary" report.
Egg-Type Chicks Hatched Down 7 Percent
Egg-type chicks hatched during August totaled 33.2 million, down 7 percent from August 2002.
Eggs in incubators totaled 31.8 million on September 1, 2003, down 4 percent from a year ago.
Domestic placements of egg-type pullet chicks for future hatchery supply flocks by leading
breeders totaled 184,000 during August 2003, down 17 percent from August 2002.
Broiler Hatch Up Slightly
The August 2003 hatch of broiler-type chicks, at 783 million, was up slightly from August of the
previous year. There were 632 million eggs in incubators on September 1, 2003, down slightly
from a year earlier.
Leading breeders placed 7.4 million broiler-type pullet chicks for future domestic hatchery
supply flocks during August 2003, down 1 percent from August 2002.
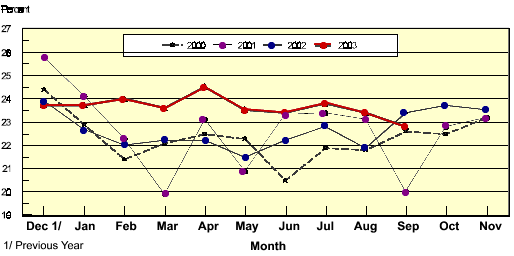
Percent Being Molted, 2000 - 2003
First of month

Procedures and Reliability
Data Sources: Primary data for the "Chickens and Eggs" report are from weekly and/or monthly
questionnaires sent to producers. An attempt is made to collect information for layer and egg estimates
from each known contractor and independent producer who has over 30,000 table egg layers. Coverage
for operations with less than 30,000 table egg layers are estimated each month based on data reported in
December. Approximately 900 contractors, independent egg producers, and started pullet operations are
contacted each month. All known hatcheries, approximately 330, are contacted for information on a
weekly and/or monthly basis.
Revisions: The previous month's estimates are subject to revision if late reports or corrected data
indicates a different level. Additionally, revisions needed after the monthly report will be made at the end
of the marketing year and published in the annual summaries of "Chickens and Eggs Summary" and
"Hatchery Production".
Procedures and Reliability: Operations are mailed a questionnaire and given adequate time to respond
by mail. Those that do not respond are phoned. Great care is exercised to ensure that all operations are
accounted for during each survey period. However, there are usually missing reports that must be
accounted for in the estimates.
Sound statistical methodology is employed to derive estimates from the reported data. All data are
checked for unusual values. All operations' data are compared to their own past operating profiles and
also to trends from other operations. Data for missing operations are estimated based on similar
operations or historical data. Survey data are subject to non-sampling errors such as omissions and
mistakes in reporting and in processing. While these errors cannot be measured directly, they are
minimized by reviewing all data for consistency and reasonableness.
Egg-type chicks hatched are comprised of all chicks of egg-type domesticated breeds including males and
chicks destined for hatchery supply flocks and research purposes. The relationship of chicks hatched to
chicken inventory and poultry marketings is carefully monitored. The disposition of egg-type chicks
hatched prior to placement into the laying flock can vary significantly, which can make comparisons to
changes in layer inventory inconsistent over time.
Intended placement data reported by leading breeders include pullet chicks expected from eggs sold the
preceding month. The breeders in this report account for a large percentage of replacement pullets for
hatchery supply flocks. Production of replacement pullets by these breeders indicates the number of
pullets available to hatchery supply flocks several months before the pullets will actually move into the
flocks. “Hatchery Supply Flocks” include all generations of layers which could lay eggs to supply a
hatchery. This includes the generations of parents, grandparents, great-grandparents, pedigree, etc. Also
included are research flocks, vaccine flocks, and specific pathogen-free flocks. The broiler cumulative
potential placements are a moving total of the intended placements 7-15 months earlier. The egg-type
cumulative potential placements of 7-18 months represent the first laying cycle. Molting and additional
laying cycles will increase the cumulative potential placements of egg-type hatching flocks.
To view the full report, including tables, please click here
Source: USDA NASS - Chickens and Eggs Report - 23rd September 2003


