

CME: <i>Acreage</i> & <i>Grain Stocks</i> Report Contain Surprises
US - The fireworks were flying the latest USDA Acreage and Grain Stocks reports, write Steve Meyer and Len Steiner.The latest USDA data contained surprises for both the nearby and deferred futures markets. 1 June corn stocks were reported to be 3.670 billion bushels, some 350 million bushels higher than pre-report estimates. In the last DLR, the stocks number was highlighted in that estimates were implying livestock feed use during Mar - May down about 9 per cent from the previous year. Better quality corn may have allowed farmers to produce more meat with lower corn use. The much higher USDA stocks estimate implies corn feed use during Mar - May which is as much as 40 per cent lower than a year ago and 29 per cent lower than two years ago. Higher use of alternative feeds, including DDGs is always a factor and comparisons to a year ago may be skewed by how poor feed quality was last year. Still, the magnitude of the decline is very significant (even compared to 2009 good quality crop) and we will have to wait until the fall for the USDA to reconcile the stocks numbers with total production estimates.

The second big surprise in the report was the number of acres planted with corn. The most recent USDA survey showed that US farmers planted 92.3 million acres with corn, 1.6 million acres more than the most recent USDA estimate and pre-report market estimates, and even slightly larger than planting intentions early this spring. This increase adds about 270 million bushels to the corn balance sheet for next year. So what happened with all the talk of flooded acres and delayed plantings? The results were a lesson in system dynamics.
Plenty of acres were flooded and planting was delayed or lost in a number of areas. But as futures advanced to record levels, this allowed farmers in areas that had favorable weather to plant more corn, either by shifting soybean acres or putting corn in acres intended for hay. The report showed that farmers in the Dakotas, Texas and Illinois planted 1.1 million fewer acres than they reported in the March survey. However, farmers in Nebraska, Iowa, Minnesota and Wisconsin planted 1.1 million more acres than they intended in March. Total planted acres of corn, wheat, soybeans, cotton and hay were 295.1 million acres compared to 298.1 million acres intended in March. USDA announced yesterday that it will re-survey farmers in four states where plantings were delayed and the results of that re-survey will be published in August. In the meantime, trade will debate the full impact of flooding as well as the possible implication that the shift in acres from one state to the next will have on final yields.
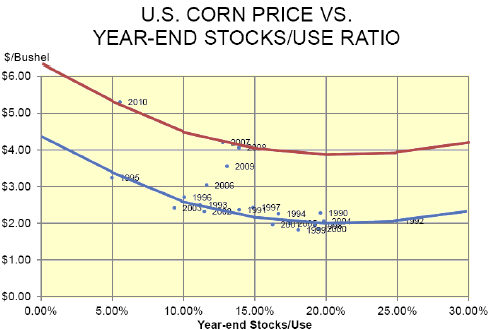
The bottom line is that taken at face value, the most recent USDA data significantly alters the supply/demand balance sheet for this year and for next. Early calculations indicate that ending stocks for next year could be as high as 1.2 billion bushels, not a bumper supply but significantly better than the razor thin stocks reported in the latest WASDE. The stocks to use ratio for next year could climb to 8.6 per cent. Tom Elam and Steve Meyer have done some work on the shift in the relationship between stocks/use ratios and corn (see chart and DLR 1/28) and an 8.6 per cent ratio could push farm cash prices below the $5 threshold.


