Bull run in US grain futures markets is in high gear, but for how long?
US grain futures markets have rallied strongly, setting multi-year highs. Can it last? 3 February 2021
 3 minute read
 By:
By: 
A combination of strong worldwide demand for grains amid weather-related supply reductions from major grain-growing regions of the globe has produced a bull market run in the grain futures that only occurs once or twice in a decade.
In recent months China has had a voracious appetite for imported grains. The world’s most populous nation with the globe’s second-largest economy last week purchased a record 5.85 million metric tons (MMT) of US corn. There are also record-setting US soybean export sales. As of Jan. 21, the U.S. had sold 3.613 MMT of soybeans for 2021-22 delivery, with 37% of that tally going to China. That tops the 2014 record of roughly 3.4 MMT sold at this point in the season. Last year at this time, just 306,265 MT of US soybeans had been sold for the next marketing year.
Strong domestic demand for US corn and soybeans also is driving the strong rally in grain futures. This week US processors crushed 5.813 million short tons of soybeans during December, which was the biggest crush on record for that month, according to USDA’s monthly Fats and Oils Report. It was the second largest soybean crush on record.
Weather that has been too dry in Brazil and Argentina corn and soybean regions has reduced crop production prospects from South America. Dry weather in Australia, Russia and Ukraine has also trimmed the wheat crop output in those regions. Russia has tried to reduce grain consumption and food price inflation by imposing tariffs on wheat exports.
All of the above could drive grain prices even higher in the coming months. However, there are some potential speed bumps that could derail the bull market in grains. China-US trade relations are still rocky and are not improving. White House spokeswoman Jen Psaki recently said the Biden administration is approaching China issues “from a position of strength, and that means coordinating and communicating with our allies and partners about how we’re going to work with China,” Reuters reported. Doug Barry, a spokesman for the US-China Business Council, downplayed concerns about any imminent cancellation of the current Phase 1 agreement, which also lays out trade targets for 2021.
A feature in the general marketplace early this year is the re-emergence of the inflation trade. Many other commodity futures markets are also in bull runs, led by crude oil. The U.S. Treasury markets are seeing rising yields, with the benchmark 10-year note yield now fetching around 1.10%, after trading below the 1.0% level since late last winter.
Meantime, the U.S. dollar index recently hit a 2.5-year low as the greenback has depreciated on the foreign exchange market. To anyone who has studied economics, it seems nearly unfathomable that the massive injections of liquidity into global financial systems over the past months (read that central banks printing money) cannot produce problematic inflation down the road. Rising commodity prices are a harbinger of that problematic inflation scenario. Problematic inflation is bullish for hard assets like raw commodities, including the grains.
© Jim Wyckoff
© Jim Wyckoff
© Jim Wyckoff
© Jim Wyckoff
© Jim Wyckoff
© Jim Wyckoff
From a technical perspective
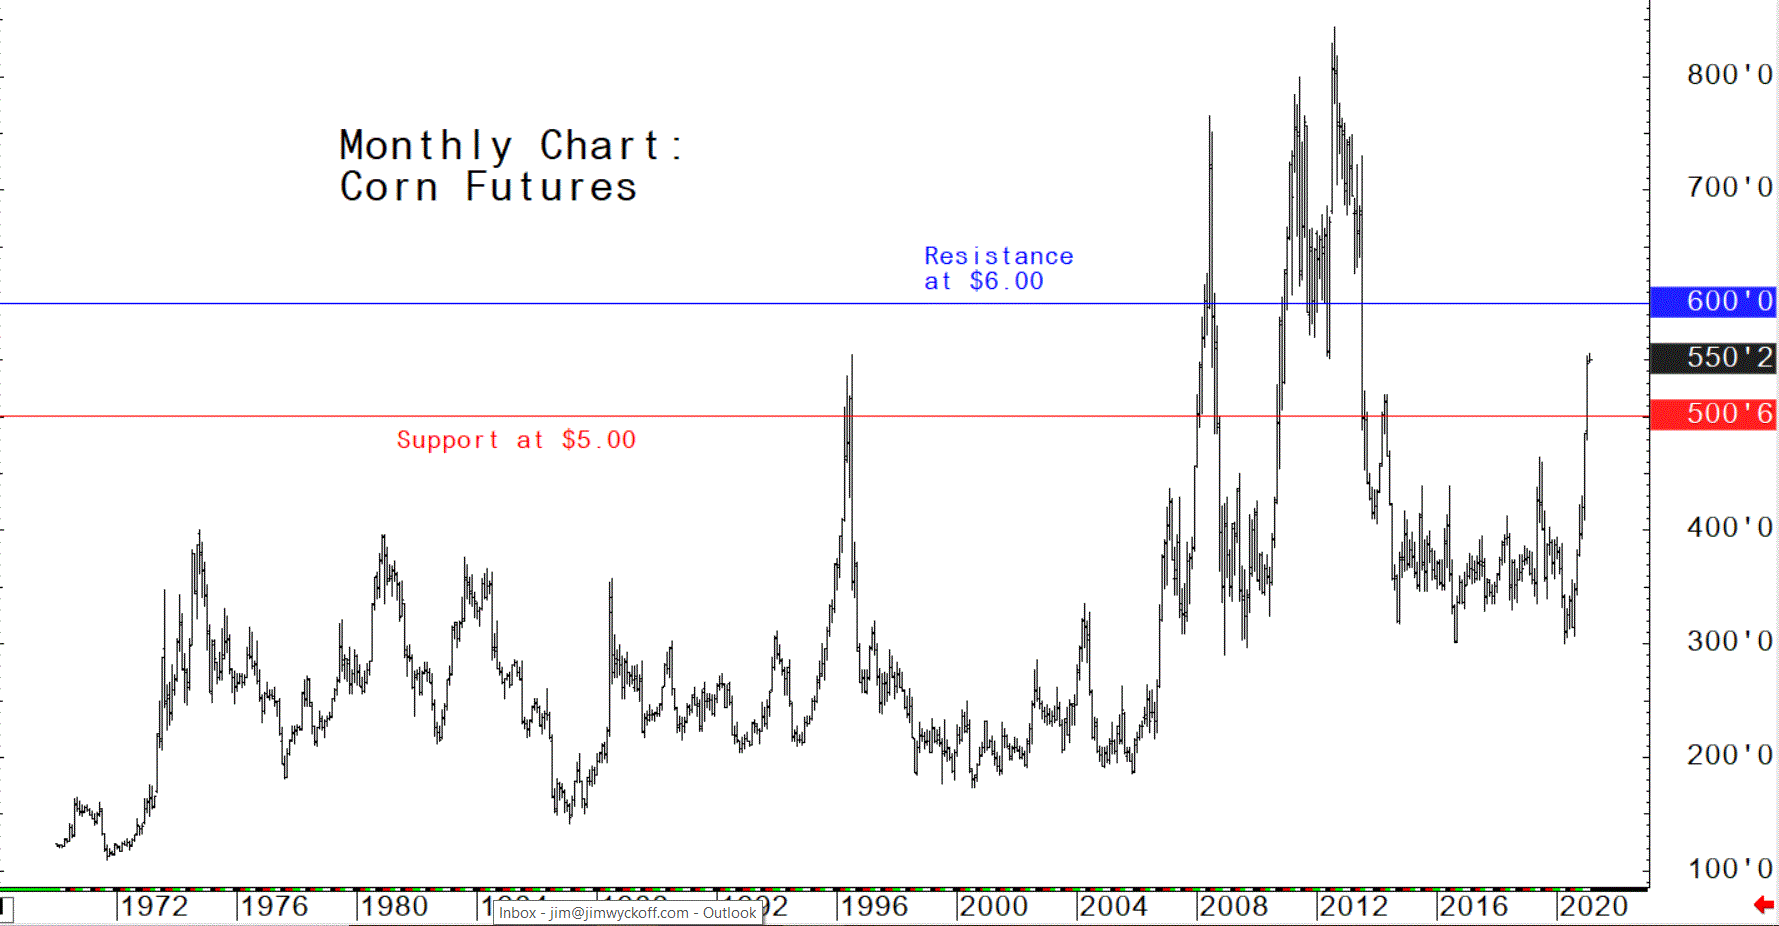
Corn
History shows that strong-trending moves in markets tend to see prices gravitate toward historical highs and lows as seen on the longer-term charts. See on the monthly continuation chart for nearby corn futures that the bull market in corn futures remains strong, with the next upside price target being psychological resistance at $6.00 a bushel. In trading parlance, the recent nearly vertical move in corn prices is termed a “parabolic” move. Such a move cannot predict how far prices will continue to rise, but it does suggest the timeframe for a market top being put in place is likely sooner rather than later. A drop in nearby futures prices below major psychological support at $5.00 would dent bullish enthusiasm to then suggest a market top is in place.
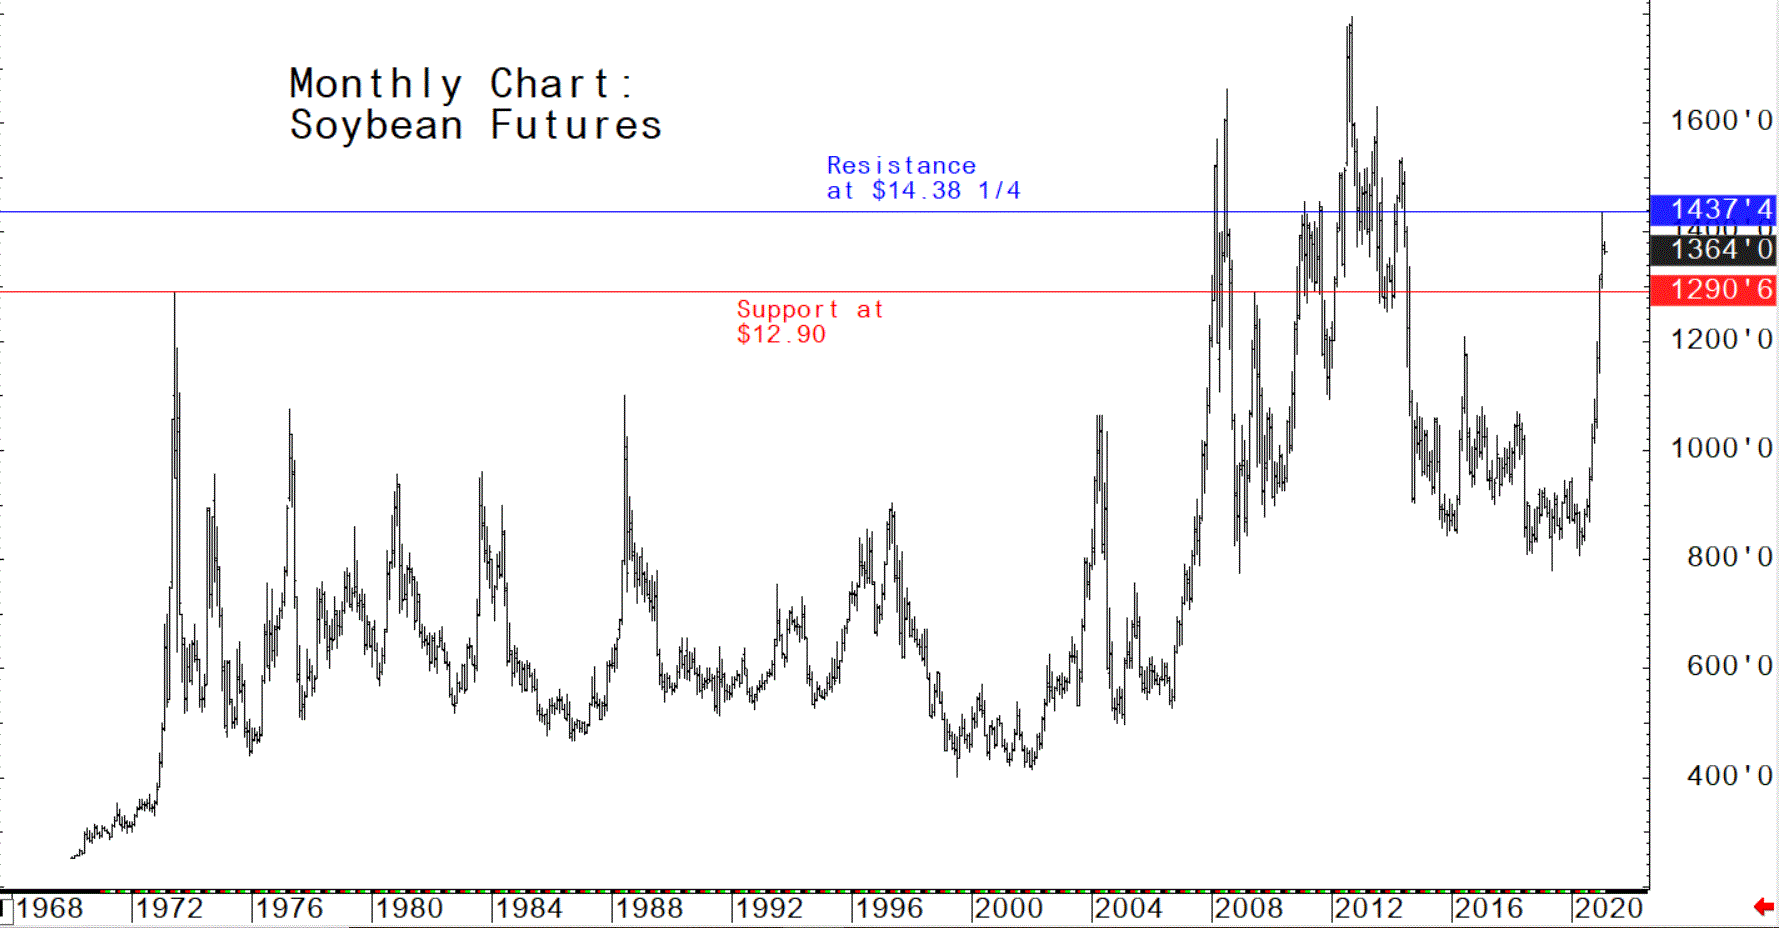
Soybeans
The soybean market has also gone parabolic. Again, how far this market can run to the upside in a short period of time remains a wild card. Note that dating back over 50 years, the monthly soybean futures chart shows that major market tops are usually spike tops, whereby prices reach a peak and then coming crashing down in rapid order. The exception is during a period from 2010 to 2014, in which nearby soybean futures prices stayed above $12.50 a bushel during that timeframe.
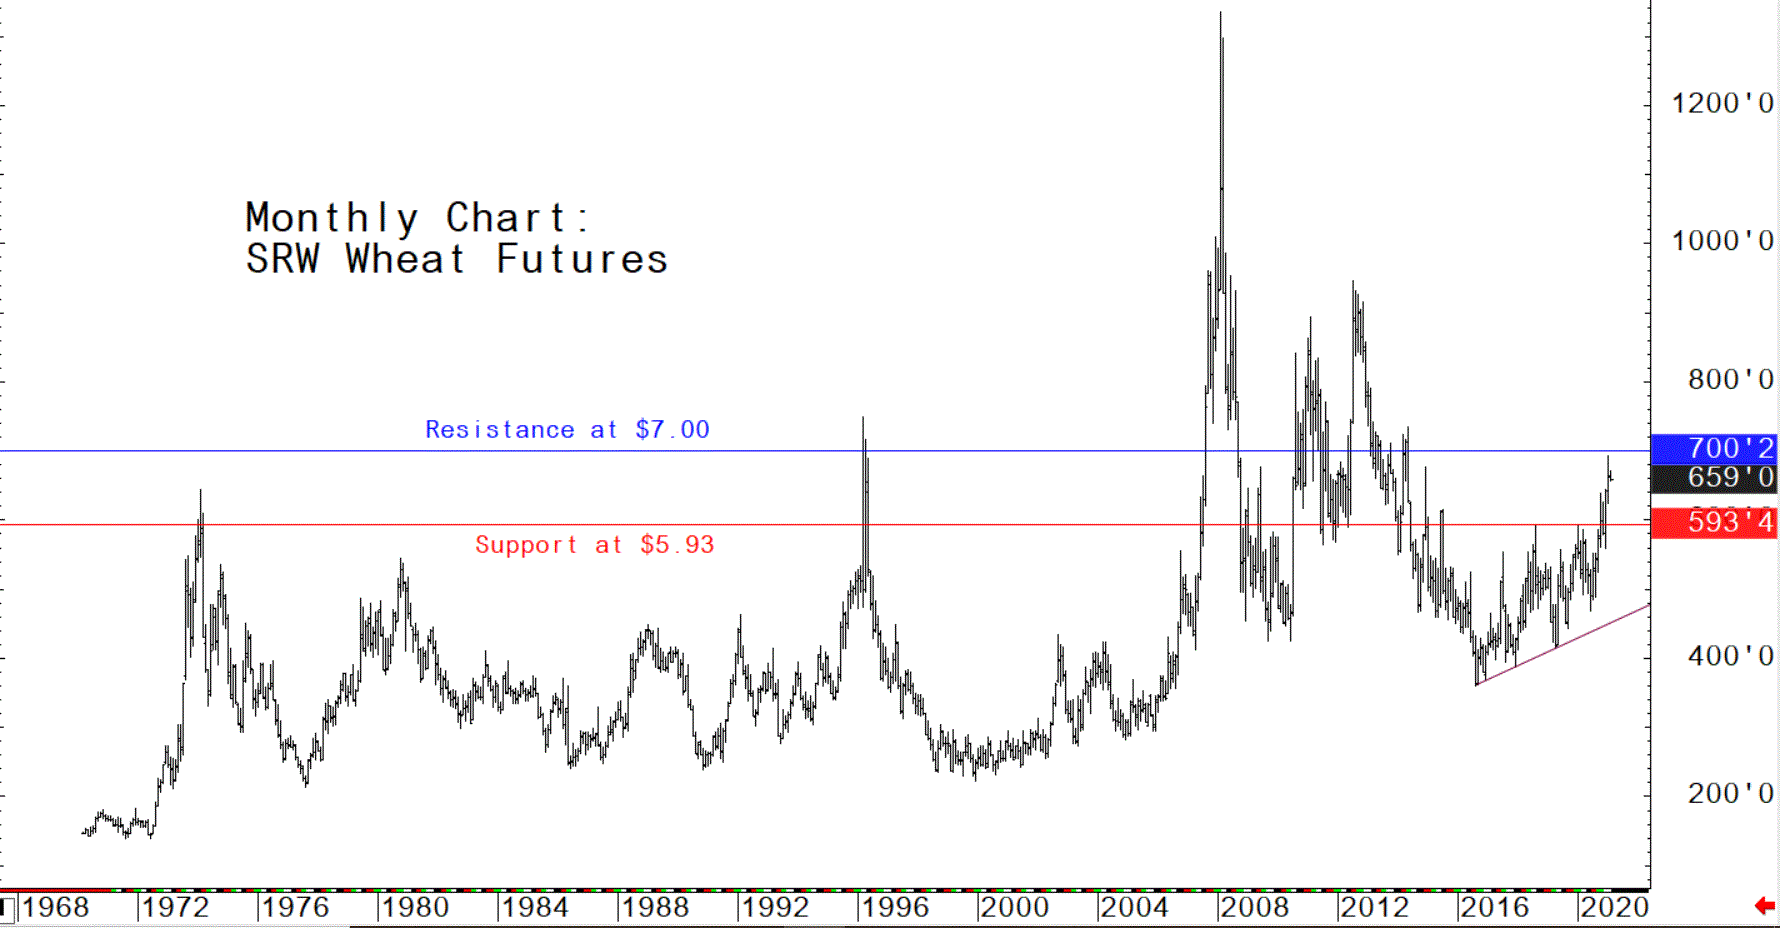
SRW Wheat
The wheat market is also trending higher, as seen on the monthly chart. It can be argued that wheat futures are more bullish than corn and soybeans. Reason: Wheat has not seen the very steep price acceleration that have corn and beans, and it can be argued that wheat needs to catch up on the upside. Big commodity fund managers who trade futures are more likely to look at wheat as a long-side play, given its tamer upside price action the past few weeks, as opposed to the more volatile price action in corn and soybean markets. Do look for wheat to be a follower of the corn and soybean futures markets in the coming weeks. If corn and soybean prices back down, wheat prices will very likely do the same.