Population diagnostics challenging for poultry veterinarians
Poultry veterinarians managing commercial flocks are epidemiologists of sorts. We have to come up with a population diagnosis based on sampling of subsets. 18 January 2021
 4 minute read
 By:
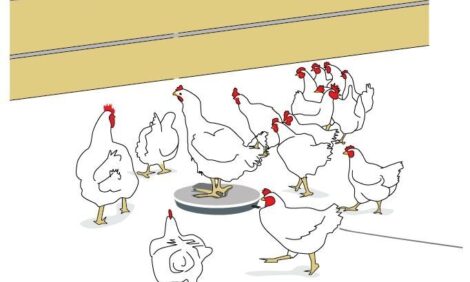
By: In poultry production, the most common sampling would include routine necropsy sessions conducted for mid-flock analysis. Typically five to six broilers are gathered from various farms at strategic ages ranging from young to market age. For a processor marketing 1 million birds per week, each five- to six-bird sample can represent 2 to 3 harvest days, or from 400,000 to 600,000 individuals! You don’t need to be a statistician to see there is no way that routine necropsy sessions can adequately reflect the health status of so many other birds.
I became painfully aware of this shortcoming recently while assessing flock health during a period of worse-than-expected broiler performance. “Normal” birds brought to necropsy sessions all had coccidial lesions but at a level that was seasonally acceptable. None had excessive amounts of parasitism.
As time went on, flocks continued to perform poorly. We conducted mortality surveys to assess dead birds along with normal-bird surveys. Even though mortality rates were low, dead birds had lethal amounts of the coccidial species Eimeria maxima and at much later ages than expected for the coccidiosis-control program in place. It was only after we performed dead-bird surveys that we figured out coccidiosis was driving poor flock performance. The experience with coccidiosis was a glaring reminder that normal-bird samples do not necessarily represent overall flock health.
The bell curve
I remember from statistics classes that populations tend to have a bell-shaped distribution, with most members being in the middle. However, if you want to see what’s dragging down a population, it seems like the bottom tail of the bell curve would be more informative. Dead birds are obviously at the bottom of the population and should indicate what’s hindering surviving birds.
Further complicating population diagnostics is the fact that not all members of a population respond the same way to the same stimulus. Consider feed toxicity in chickens, which rarely affects an entire flock. Some chickens may die while others have no clinical signs. How about lethal dose 50 — the dose of any substance required to kill half of the the animals tested in challenge studies? Why do half of the animals survive and half die when they’ve received the same dose?
Tip-offs
Don’t get me wrong. Epidemiology and population diagnoses that depend on smaller subset sampling is valuable in poultry production. They help us evaluate flock health and can provide tip-offs to emerging problems before they escalate any further.
We can also use larger data sets to improve the health of the flocks under our care. Shared industry-performance statistics may be prone to misrepresentation, but by increasing the size of the population, larger trends may be seen that aren’t apparent based on one integrator’s own numbers. We can learn from others’ experience and choose interventions to keep the flocks under our care as healthy as possible with current technology. Whatever baseline used, differences from average can be meaningful even if results aren’t statistically significant.
When it gets down to it, population medicine is mostly what poultry veterinarians do. Unlike our companion-animal counterparts, we aren’t limited to one animal and one diagnosis. We get to work with whole groups of animals to help the greater community. We are epidemiologists.