


Weekly global protein digest: China’s poultry forecast, US & CAN beef inventory down, US dairy pricing reform
Analyst Jim Wyckoff shares this week's global protein news By:
By: Weekly USDA export sales for US beef, pork
Beef: Net US sales of 18,200 MT for 2023 were up 59 percent from the previous week and 35 percent from the prior 4-week average. Increases were primarily for China (6,100 MT, including decreases of 300 MT), Japan (3,400 MT, including decreases of 900 MT), South Korea (2,400 MT, including decreases of 500 MT), Taiwan (1,500 MT, including decreases of 100 MT), and Mexico (1,500 MT, including decreases of 200 MT). Net sales reductions of 500 MT for 2024 resulted in increases for Mexico (200 MT), were more than offset by reductions for Japan (600 MT). Exports of 19,900 MT--a marketing-year high--were up 69 percent from the previous week and 31 percent from the prior 4-week average. The destinations were primarily to China (4,900 MT), Japan (4,600 MT), South Korea (4,100 MT), Mexico (1,900 MT), and Taiwan (1,300 MT).
Pork: Net US sales of 36,900 MT for 2023 were up 12 percent from the previous week and 45 percent from the prior 4-week average. Increases were primarily for Mexico (12,000 MT, including decreases of 500 MT), China (7,800 MT), South Korea (5,500 MT, including decreases of 600 MT), Japan (4,200 MT, including decreases of 300 MT), and Canada (1,900 MT, including decreases of 1,200 MT). Total net sales of 400 MT for 2024 were for Japan. Exports of 31,300 MT were up 24 percent from the previous week and 16 percent from the prior 4-week average. The destinations were primarily to Mexico (13,000 MT), Japan (4,400 MT), China (3,000 MT), South Korea (2,700 MT), and Canada (2,700 MT).
USDA: United States and Canadian Hog Inventory Down Slightly
USDA reports United States and Canadian inventory of all hogs and pigs for June 2023 was 86.2 million head. This was slightly lower than June 2022 and down 2 percent from June 2021. The breeding inventory, at 7.39 million head, was slightly lower than last year and down 1 percent from 2021. Market hog inventory, at 78.8 million head, was slightly lower than last year and down 2 percent from 2021. The semi-annual pig crop, at 80.0 million head, was up 1 percent from 2022 but down 1 percent from 2021. Sows farrowing during this period totaled 7.06 million head, down 1 percent from last year and down 2 percent from 2021.
United States inventory of all hogs and pigs on June 1, 2023 was 72.4 million head. This was up slightly from June 1, 2022 but down 1 percent from March 1, 2023. The breeding inventory, at 6.15 million head, was down slightly from last year, but up 1 percent from the previous quarter. Market hog inventory, at 66.2 million head, was up slightly from last year, but down 1 percent from last quarter. The pig crop, at 32.9 million head, was up 1 percent from 2022 but down 1 percent from 2021. Sows farrowing during this period totaled 2.90 million head, down 2 percent from 2022 and down 5 percent from 2021.
Canadian inventory of all hogs and pigs on July 1, 2023 was 13.8 million head. This was down 1 percent from July 1, 2022 and down 4 percent from July 1, 2021. The breeding inventory, at 1.24 million head, was down slightly from last year and down 2 percent from 2021. Market hog inventory, at 12.5 million head, was down 1 percent from last year and down 4 percent from 2021. The semi-annual pig crop, at 15.0 million head, was up 1 percent from 2022, but down 2 percent from 2021. Sows farrowing during this period totaled 1.25 million head, up 1 percent from last year, but down 2 percent from 2021.
USDA: United States and Canadian Cattle Inventory Down 3 Percent
USDA reports all cattle and calves in the United States and Canada combined totaled 108 million head on July 1, 2023, down 3 percent from the 111 million head on July 1, 2022. All cows and heifers that have calved, at 43.4 million head, were down 2 percent from a year ago. All cattle and calves in the United States as of July 1, 2023, totaled 95.9 million head, down 3 percent from July 1, 2022. All cows and heifers that have calved, at 38.8 million head, were down 2 percent from a year ago. All cattle and calves in Canada as of July 1, 2023, totaled 12.2 million head, down 1 percent from the 12.3 million head on July 1, 2022. All cows and heifers that have calved, at 4.62 million head, were down 1 percent from a year ago.
FSA updates LIP payment rate for Midwest livestock producers
USDA’s Farm Service Agency (FSA) is updating the Livestock Indemnity Program (LIP) payment rate to support livestock producers in the Midwest who have lost cattle to the extreme heat and humidity experienced this summer. To help indemnify ranchers to reflect a trend towards higher cattle weights in feedlots, the 2023 LIP payment rate for beef calves over 800 lbs. will increase from $1244 per head to $1618. LIP provides benefits to livestock owners and some contract growers for livestock deaths exceeding normal mortality from eligible adverse weather events, certain predation losses and reduced sales prices due to injury from an eligible loss. Indemnity payments are made at a rate of 75% of the prior year’s average fair market value of the livestock. The updated LIP payment rate is effective immediately and will be applied retroactively starting Jan.1, 2023, for all eligible causes of loss including excessive heat, tornado, winter storms and other qualifying adverse weather. Producers who have already received LIP payments for 2023 losses will receive an additional payment, if applicable, commensurate with this updated rate.
China’s sow herd inches lower in July
China’s sow herd in July fell 0.6% against the prior month to 42.71 million head, ag ministry data showed. The sow herd was also 0.6% smaller than last year. Hog slaughter in July jumped 26.7% from last year.
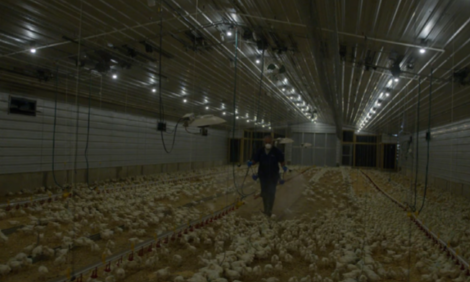
USDA reports on China’s poultry industry
Production: China chicken meat production is forecast lower for from both white broiler and yellow broiler in 2024. White broiler production is expected to decline because of HPAI-related import restrictions that impact avian genetics and related products. Yellow broiler production is expected to decline as officials close live poultry markets. In 2024, chicken production from 817 broilers (i.e., a hybrid chicken variety) could witness further growth off a relatively small base.
Consumption: Both white and yellow chicken consumption is forecast to decline in 2024. Consumption of white broiler chicken products is forecast to decline because of domestic supply constraints and HPAI-related restrictions on chicken meat imports. Consumption of yellow broiler chicken products is forecast to decline mainly due to closures of live poultry markets. Trade: In 2024, chicken imports are forecast to grow by 3 percent to 770 thousand metric tons (MT) in order to partially meet the supply gap of domestic chicken production.
Chicken exports are expected to stay at similar levels in 2024
USDA initiates public hearing to discuss reforms in US dairy pricing
The hearing will include the presentation of 22 competing proposals and aims to address pricing reform in the dairy sector. Notable proposals come from the National Milk Producers Federation (NMPF) and the International Dairy Foods Association (IDFA), both of which initially sought to collaborate on reforms but differed in the scope of their proposals.
NMPF's proposal aims to revert to a pre-2018 Farm Bill formula for the Class I mover, determining milk prices based on rates for Class III (used in cheese) and Class IV (including butter and milk powder). It also suggests updates to make allowances and other formula components.
IDFA's proposal, initially focused on make allowances, has been revised to include changes to the Class I mover as well. It seeks a hybrid approach, combining aspects of the current mover with the pre-2018 approach to ensure a guaranteed floor for Class I prices.
The proposals address key elements like formula adjustments, component factors, and differential pricing. During the hearing, these proposals will be presented to USDA officials, with testimony expected to last several weeks.
Following the hearing, USDA will create a draft recommendation for reform and gather additional comments before issuing a final decision. Dairy producers will then vote on these changes in a national referendum anticipated for the second half of 2024.
Both NMPF and IDFA welcome the hearing as a chance to address outdated pricing structures and advance reforms that suit the dairy industry's needs. The reform process aims to balance risk management and pricing fairness across different classes of milk, reflecting the broader interests of dairy stakeholders.
Weekly USDA dairy report
CME GROUP CASH MARKETS (8/25) BUTTER: Grade AA closed at $2.6700. The weekly average for Grade AA is $2.7020 (-0.0185). CHEESE: Barrels closed at $1.8000 and 40# blocks at $1.9450. The weekly average for barrels is $1.8045 (-0.0090) and blocks, $1.9450 (-0.0680). NONFAT DRY MILK: Grade A closed at $1.1050. The weekly average for Grade A is $1.1000 (+0.0020). DRY WHEY: Extra grade dry whey closed at $0.2800. The weekly average for dry whey is $0.2630 (-0.0015).
BUTTER HIGHLIGHTS: In the West, cream volumes are tightening, and some processors say availability is on the short side. Meanwhile in the Central region, cream has become more available amid school milk cream spin off and softening Class II orders. Some butter makers in the region are sourcing cream from the West region and from locally sourced suppliers. In the East some contacts anticipate cream availability will increase in the near term. Meanwhile, regional butter makers are micro-fixing frozen bulk butter, and relying on contracted loads of cream for churning. Contacts in the Central region say butter churning is increasing. Butter makers in the West report mixed schedules as some say they are running steady or reduced production schedules, while others have stopped churning. Demand for butter is strong in the Central region, while contacts in the East say retail and food service sales are steady. In the West, demand for butter from retail and food service purchasers is strong to steady. Bulk butter overages range from 2.0 to 10.0 cents over market value.
CHEESE HIGHLIGHTS: In the Northeast, Class I milk processors are ordering increased, volumes reducing availability into cheese processing. Plant managers in the region suggest this, and persistent labor issues, are contributing to lighter cheese production. Spot milk prices range from at Class III to $.50 over Class in the Midwest, though some stakeholders say spot load offers have dried up in recent weeks. Some cheesemakers in the Midwest relay downtime for a day or two at plants to complete updates. In the West, cheese production is steady, and cheese inventories are available in the region. Cheese inventories are steady in the Northeast, while Midwest contacts report balanced inventories. Cheese sellers in the Midwest say demand in mid/late August is comparable to previous years. In the Northeast, contacts report stronger demand for cheddar than other American-type cheeses. Food service demand for mozzarella cheese is strong in the region. In the West, domestic demand is strong to steady. Meanwhile, stakeholders say export demand is quieter overall.
FLUID MILK: Cow comfort in the Northeast has improved due to cool nights and lower humidity. That area is an exception to the rule this week, though, as a lot of the country is experiencing intense and consistent heat and dryness. Southwestern states are still hot, but after a long stretch of triple digit temperatures, current highs in the mid-90s have brought some relief to locals there, but those highs are not necessarily moving the milk output needle upward. Class I demand has been bolstered in most areas by schools reopening for the year. Cream availability, as a result of cream spinoff, has increased for Midwestern and Eastern cream end users. Multiples eased in the Central and East. Class III spot milk prices ranged from Class to $.50 over Class in the upper Midwest. Condensed skim availability has mirrored fluid milk, which has seasonally tightened in recent weeks. F.O.B. cream multiples are 1.36-1.45 in the East, 1.24-1.44 in the Midwest, and 1.19-1.39 in the West.
DRY PRODUCTS: Dried dairy ingredients, in most areas, remain under some sideways to bearish tones, on the whole. Prices were steady to lower for low/medium heat dry milk (NDM) in the Central/ East regions, while they shifted lower in the West. International demand for NDM remains light. Prices for dry buttermilk were steady in the Central/East, while moving lower in the West. Dry buttermilk tones are soft, as demand remains somewhat tepid across the country. Dry whole milk prices were unchanged, as processing foci remain on contractual needs. Dry whey prices were steady to higher across all regions. Seasonal milk output limitations and shifts into high protein blend processing has given the whey powder markets some indications of potential buoyance. Whey protein concentrate 34% prices moved lower, as demand continues to be reported as quiet. Lactose prices moved higher, as domestic demand is at least slightly more active. Rennet casein prices were steady, while acid casein prices shifted down. Export demand from Oceania for acid casein has been quieter in recent weeks.
ORGANIC DAIRY MARKET NEWS: The Agricultural Marketing Service (AMS) reported that the June 2023 U.S. sale of total organic milk products was 224 million pounds, down 4.5 percent from the previous year, but up 2.0 percent year-to-date. Organic whole milk sales, 112 million pounds, rose 2.9 percent compared to a year earlier while increasing 3.0 percent year-to-date. Reduced fat milk (2%) sales were 72 million pounds, down 7.4 percent from the previous year and down 4.9 percent year-to-date. Organic flavored whole milk sales, 1 million pounds, decreased 66.1 percent from the previous year, while declining 59.4 percent year-to-date. Meanwhile, the August 2023 survey of selected retail supermarkets in 30 U.S. cities cited the retail prices of organic whole milk in the half gallon container. Prices ranged from $3.99 in multiple cities to $6.44 in St. Louis, MO. The July 2023 simple average price of $4.86, displayed a small increase compared to $4.85 last month.
NATIONAL RETAIL REPORT: Total conventional dairy ads decreased by 7 percent, while organic dairy ads increased by 41 percent. Cheese was the most advertised dairy commodity despite a 15 percent decrease in ads for conventional cheese. Conventional sliced, shredded, and block cheese in 6–8-ounce packages were heavily advertised. The sliced type had a weighted average advertised price of $2.19, down 26 cents. The shredded type had a weighted average advertised price of $2.44, down 1 cent. The block type had a weighted average advertised price of $2.72, up 14 cents.


 3 July 2026
 3
minute read
3
minute read